This article has been reviewed according to Science X's editorial process and policies. Editors have highlighted the following attributes while ensuring the content's credibility:
fact-checked
trusted source
written by researcher(s)
proofread
Remember the climate map from your school atlas? Here's what climate change is doing to it

You probably saw a multi-colored climate map at least once in school. You might have pored over it, fascinated. Was Antarctica really a cold desert? And why was so much of Russia listed as tundra?
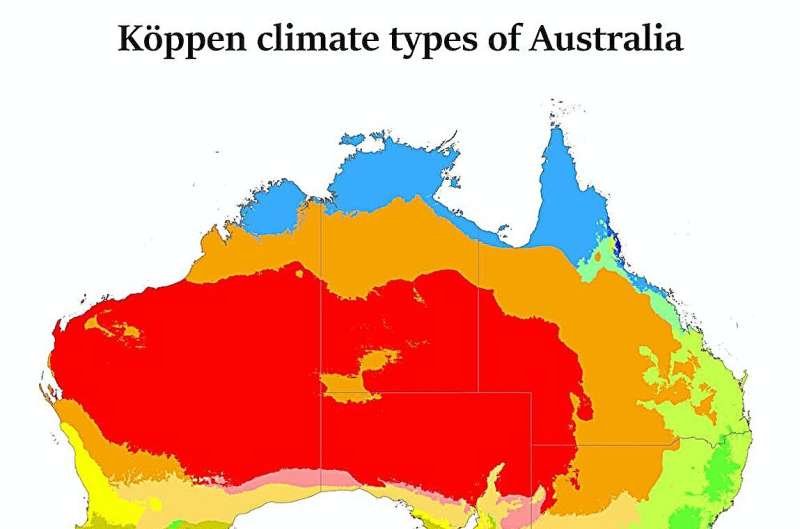
Almost always, those maps were based on the climate classification system proposed by Wladimir Köppen. The colors are chosen to suit our imagination: Australia with its red desert center, surrounded by a yellow or orange semi-arid fringe and more lush green climates along many coastlines and hinterland.
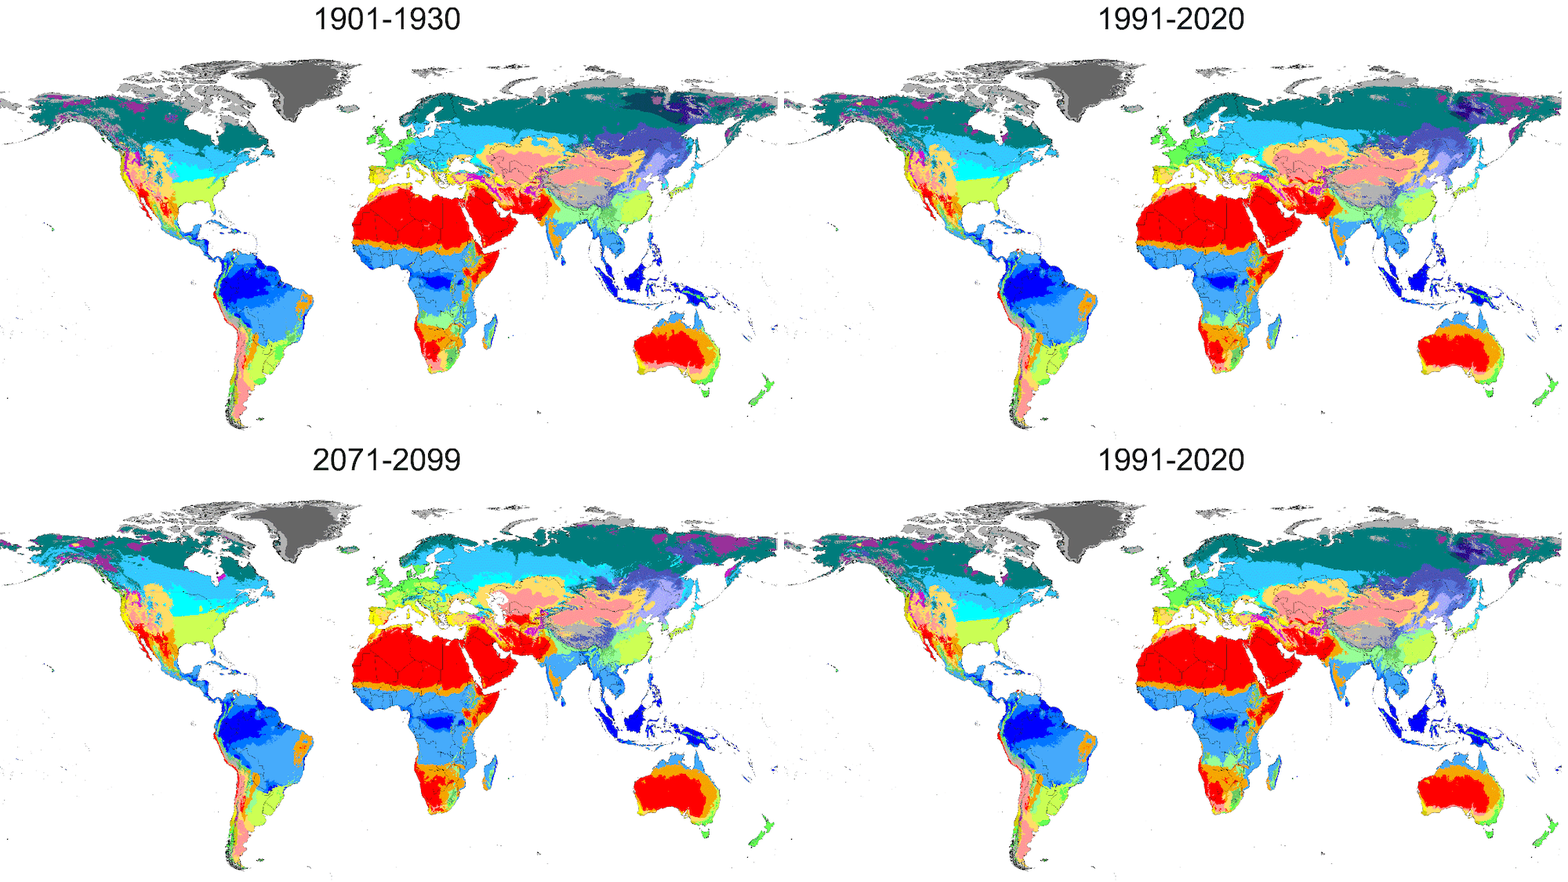
But these maps were made for a climate that doesn't exist any more. Our new research shows just how fast climate change has altered these maps—and how they will continue to change.
Our web app lets you see for yourself for any country in the world and for different emission scenarios. For Australia, you can watch the hot desert area expand and the temperate areas shrink.
The climate map of the future below assumes nations meet their climate goals. It could be far worse. Or it could be better, if we finally treat climate change with the urgency it needs.
How do you classify a climate?
Köppen was a 19th century Russian botanist who later retrained in meteorology. Over his career, he combined both interests, becoming fascinated by the relationship between climate and types of vegetation.
Around 1900, he proposed the influential climate classification system which now bears his name alongside his collaborator, Rudolf Geiger. It remains by far the most used classification system, as it combines different aspects of climate data into types of landscapes and vegetation types we can actually picture, from rainforests, savannahs and deserts to temperate and boreal forests, tundras, glaciers and ice sheets.
The Köppen-Geiger classification has five major climate classes: tropical, dry, temperate, cold and polar. These are divided into 30 subclasses based on the amount of rain and temperatures in summer and winter.
You might think it would be relatively straightforward to figure out if climate change has pushed a region into a new classification. Add the recorded global warming of 1.2°C so far and see if that changes anything.
Alas, it's not that simple. This is because climate change can have weird regional effects. We're getting much more rain in some areas, and much less in others. Some regions are warming faster than the global average and others are warming slower.
Climate models predict there will continue to be such differences. Plus, a degree of warming will have a greater impact at the edge of a glacier than in the Sahara.
To find out what will happen, we analyzed vast databases of past weather observations and future climate projections under different socio-economic and emission pathways to redraw the Köppen map. We did so at a very fine scale, dividing the world up into square kilometers so we could observe localized changes in mountainous regions and on small islands.
Change has already happened—and there's much more to come
The results were surprising. In some parts of the world, climate zones have already shifted considerably since Köppen drew his first climate map more than a century ago. The fastest change has been in the last few decades. The largest changes have been in cold and polar climates, which have become less cold and sometimes drier.
Eastern Europe has been a climate change hotspot over the last century. Its continental climate of cold winters and warm summers has given way to a temperate climate with hot summers.
Several countries have already changed climate zones across more than half of their area. Hungary, for instance, has changed the most of any nation. A whopping 81% of the country has already moved into a different, more temperate climate zone. Other global hot spots include central Europe, the Middle East and South Korea.
Our projections show these regions are among those to undergo the biggest climatic shifts through to 2100. Some areas will shift climate zones more than once.
Countries at higher latitudes will see some of the largest changes. Almost a quarter (24%) of both Canada and Russia have already moved into another climate zone since Köppen's first map. Another 39-40% of their immense landmasses will follow suit before the end of the century.
A similar story applies to Europe, where climate zones will change in between one-third and two-thirds of the area in most countries.

South Africa and neighboring countries Eswatini and Lesotho are the fastest changing countries in the Southern Hemisphere. Their climate zones have shifted across 28% of their combined area. By 2100, an additional 44% will change.
In Australia, climate zones have already shifted across 14% of the country, with another 13% predicted during the remainder of this century.
You might wonder how it can be that climate zones don't move in some areas. That is because each Köppen climate zone represents a specific range of temperature and rainfall conditions, and a region can move within that range.
But Köppen didn't foresee what's happening now. In his classification, deserts and tropical climates are at the high end of the temperature scale and cannot change—they just get hotter.
What will this mean on the ground?
Changes as dramatic and rapid as this are already upending natural ecosystems. As climate change progresses, it will force significant change to our farms and infrastructure. Humanity gets half its calories from just three plants—rice, maize and wheat—and each of these has a preferred climate.
Warmer and drier climates bring more drought as well as crop loss, water shortages, ecosystem degradation, bushfires and desertification. Warmer winters, extreme heat, drought and fire have been pummeled forests the world over—from the cold high latitudes in Canada and Russia to the dry forests in the Mediterranean region, California and Australia. Even the Amazon rainforest is affected.
Of course, some changes may be beneficial for people, such as better agricultural conditions or lower heating costs in cold regions. But the overall picture is one of calamitous change.
Over the next decades, it will take all of humanity's commitment and ingenuity to avoid a major climate catastrophe.
Provided by The Conversation
This article is republished from The Conversation under a Creative Commons license. Read the original article.![]()


