Highly accurate permafrost maps of the Northern Hemisphere published

Researchers from the Northwest Institute of Eco-Environment and Resources of the Chinese Academy of Sciences (CAS) and their collaborators published a high-accuracy and high-resolution permafrost map over the Northern Hemisphere.
They integrated the unprecedentedly large amounts of field data and multisource geospatial data, especially remote sensing data, using multi- machine learning model with an ensemble strategy.
Related results were published in Earth System Science Data.
The permafrost distribution and thermal state (i.e., mean annual ground temperature or MAGT, active layer thickness or ALT) are important for studies on climatology, hydrology, ecology, agriculture, public health, and engineering planning in cold region.
With the accumulation of ground observation data and remote sensing data, it is possible to mapping the permafrost over the Northern Hemisphere with a high accuracy and higher resolution.
The researchers compiled a ground measurement database in the Northern Hemisphere through international cooperation and literature review. The database contains unprecedentedly large amounts of field data (1,002 boreholes for MAGT and 452 sites for ALT) for the period of 2000–2016.
Then, they used the four statistical/machine learning techniques include the generalized additive model, support vector regression, random forest, and extreme gradient boosting to integrate these intensive ground observation and spatial data. Cross-validation indicated that the maps were more accurate than those of previous circumpolar maps.
The study indicated that the distribution of MAGT displayed an obvious latitudinal gradient from the zone of extremely cold (2 °C) permafrost in alpine and high-plateau regions at low latitudes, such as the Qinghai-Tibet and Mongolian plateaus, as well as the Yablonovy and Stanovoy mountains in southeastern Russia.
Besides, the pattern of ALT was generally similar to that of MAGT, but the details varied markedly. The regional average ALT varied from 76.95±21.69 cm in the High Arctic to 232.40±47.95 cm in the alpine and high-plateau permafrost regions at low latitudes with a narrow transition zone in the Mongolian Plateau and Northeast China.
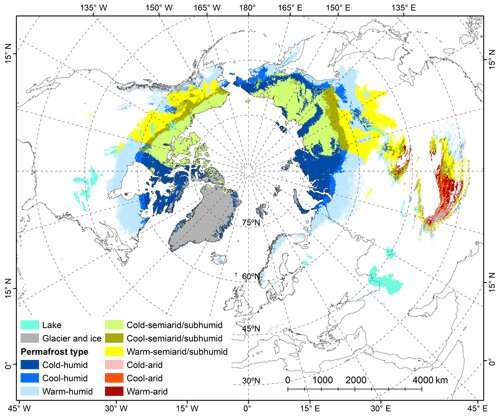
The new maps show that the permafrost area is approximately 14.77 (13.60–18.97) ×106 km2 over the Northern Hemisphere, excluding glaciers (approximately 0.64×10⁶ km2) and lakes (approximately 0.3×10⁶ km2), while the areal extent of the permafrost region is approximately 19.82×10⁶ km2 with different occurrence probabilities.
The hydrothermal conditions of permafrost are variable from the warm-arid type dominating on the Qinghai-Tibet Plateau to the cold-humid type dominating in the High Arctic. The areas of cold, cool, and warm permafrost regions are approximately 7.49×10⁶ (37.80%), 2.84×10⁶ (14.30%), and 9.49×10⁶ km2 (47.90%), respectively.
The datasets include MAGT, ALT, permafrost probability, and the permafrost hydrothermal zonation are publicly available at https://data.tpdc.ac.cn/en/data/5093d9ff-a5fc-4f10-a53f-c01e7b781368/.
More information: Youhua Ran et al, New high-resolution estimates of the permafrost thermal state and hydrothermal conditions over the Northern Hemisphere, Earth System Science Data (2022). DOI: 10.5194/essd-14-865-2022
Provided by Chinese Academy of Sciences


