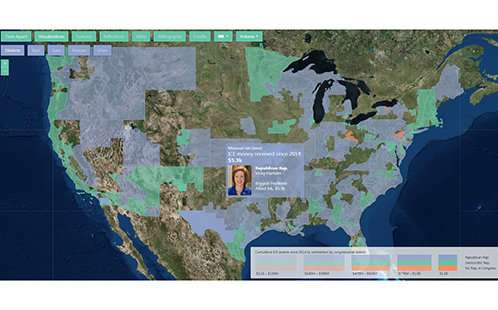
Interactive research map reveals multi-billion-dollar U.S immigration industry

An interactive website which investigates the rising investment in detention, enforcement, and deportation of immigrant families in the U.S has been released by a group of researchers and academics this week.
The virtual resource charts financial contracts that the U.S government has with companies to supply goods and services required for detention, surveillance, and deportation of immigrants. This includes everything from IT supplies and services for Immigration and Customs Enforcement (ICE) offices, toiletries for detainees and even ammunition and taser accessories.
The website was co-built by Associate Professor Rachel Hendery from Western Sydney University's Digital Humanities Research Group. Associate Professor Hendery contributed to the programming, design and analysis work for the platform.
The interactive data exploration reveals that ICE government contract values have increased 987 percent since 2014— and they have almost doubled in the past year.
Associate Professor Hendery said the research found the U.S government and businesses are heavily profiting from the detainment of immigrants.
"Businesses like Deloitte have various ICE contracts which collectively amount to $250 Million— and they aren't the biggest," Associate Professor Hendery said.
"Amazon, LinkedIn and Dell are just some of the household names of organisations that are a part of the Immigration and Customs Enforcement 'industry'.
"I don't think people are aware of the scale of this immigration prison industry, nor that it really is an industry, with all kinds of financial and other incentives for the status quo to continue, or as our data suggests, scale up even further," she said.
The map is divided into 'visualisations' which provide different data on the financial industry of the immigration system. The visualisations include:
- Monetary amounts of ICE contracts in each congressional district
- ICE contracts from 2014-2018 showing the exponential growth of economic activity within the immigration system.
- An exposé of some of the most egregious participants in the ICE economy.
- An in-depth look at the expenditure categories for ICE contracts.
- Re-displacements from the US since 2012 by port of removal.
- A map of allies, double vetted for trustworthiness.
Professor Hendery said that maps and other interactive data visualisations that were used in the project help extract narratives from complex figures in a way that looking at numbers does not.
"Most people reading or hearing about immigration in the U.S are operating without all the information. It's hard to understand how large the ICE machinery is, or what the scale of their financial web is like."
The research makes up the second volume of the Torn Apart/ Separados project which provides a deep and radically new look at the culpability behind the humanitarian crisis in the United States. The project is made up of an interdisciplinary cohort of researchers around the world who combine technical skills and classical research practices to help mobilise humanity.
Provided by University of Western Sydney


