Big-data visualization experts make using scatter plots easier for today's researchers

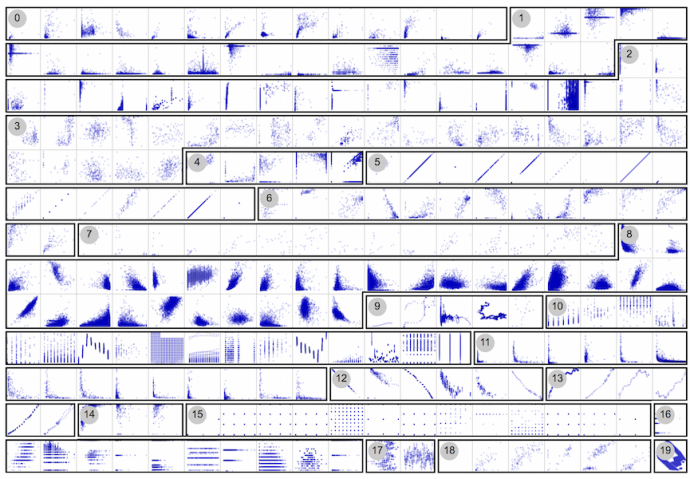
Scatter plots—which use horizontal and vertical axes to plot data points and display how much one variable is affected by another—have long been employed by researchers in various fields, but the era of Big Data, especially high-dimensional data, has caused certain problems. A data set containing thousands of variables—now exceedingly common—will result in an unwieldy number of scatter plots. If a researcher is to extract useful information from the plots, that number must be winnowed in some way.
In recent years, algorithmic methods have been developed in an attempt to detect plots that contain one or more patterns of interest to the researcher analyzing them, thereby providing a measure of guidance as the data is explored. While those techniques represent an important step, little attention has been paid to validating their results by comparing them to those achieved when human observers and analysts view large sets of plots and their patterns.
Members of Tandon's data-visualization group, headed by Professor Enrico Bertini, have conducted a study that found that results obtained through algorithmic methods, such as those known as scagnostics, do not necessarily correlate well to human perceptional judgments when asked to group scatter plots based on their similarity. While the team identified several factors that drive such perceptual judgments, they assert that further work is needed to develop perceptually balanced measures for analyzing large sets of plots, in order to better guide researchers in such fields as medicine, aerospace, and finance, who are regularly confronted with high-dimensional data.
More information: Rahul Singh et al. Towards human-computer synergetic analysis of large-scale biological data, BMC Bioinformatics (2013). DOI: 10.1186/1471-2105-14-S14-S10
Provided by New York University


