Analyzing Ross Ice Shelf radar data

The lines of data are slowly creeping across our Ross Ice Shelf GIS map and with each new line comes an improved understanding of Ross Ice Shelf. What can you learn from a 'snapshot' of data? The radar image above contains a nice story. You can see the ice thickness in the Y-axis of the annotated radar image. The ice shelf is approximately 300 meters thick. For scale this means you could stand 3 statues of liberty one on top of another and still have 21 meters of ice layered above them. The top layer on the ice shelf is snow that has accumulated on the surface of the shelf, layered almost flat as it fell on a level ice surface. Below you can see the ice that has flowed in from the Antarctic ice sheet with rumpling and roughness collected as it moved over the rougher terrain of the bed topography. Below that you can see the faint outline of the bottom of the ice shelf. This is where the radar stops, unable to image through the ocean water.
The radar and gravity work together to create a complete image of the Ross Ice Shelf and the bed below. Radar provides information on the ice layers but stops where the gravity excels, at the ice/ocean interface. With two gravimeters strapped down side by side in the LC130 and humming away as they collect data, the dual instrumentation has the project well covered.
A schedule of flying two flights a day can be exhausting. However, the limited time in an Antarctic field season led to the plan to fly with two crews so data can be collected day and night; after all radar, gravity and magnetics don't need the light to collect images. The personnel have been broken into teams so there is a constant rotation of working, sleeping and data review. The small cohort in the science team has been training each other on the various instrument operations to provide more flexibility in the flight planning.
Being on the ice can be an intense and compressed time… but it can also be filled with unexpected problems and delays. Weather has cancelled several flights, as have priority needs of the guard to handle emergencies and support missions. The cold, dry static environment can be hard on equipment and a couple of the laptops used to manage the data have stopped working adding stress to the workload, as has illness. Although the team has been challenged by the cold and the weather they have managed 6 flights with more on the upcoming docket.
The team has taken advantage of down days to share presentations about the ROSETTA project with the other residents of McMurdo and Scott Bases. McMurdo and Scott are both located on Ross Island just at the edge of the Ross Ice Shelf. McMurdo is home to the U.S. research teams housing about 1000 residents during the austral summer season. Scott Base is home to the New Zealand teams, with close to 100 during the austral summer season. Sharing science is one of the perks of polar fieldwork.
Check out the newest lines on the GIS map and stop back for more. As we write the team is gearing up for another flight….and more lines of data with more stories.
-
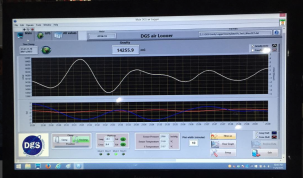
Gravity data collected on the bed below the ice shelf. Credit: Matt Siegfried -
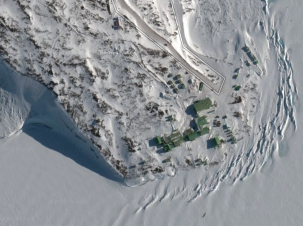
Scott Base, Ross Island, Antarctica, New Zealand research base. -
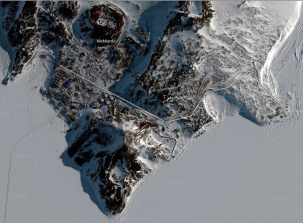
McMurdo Base, Ross Island, Antarctica U.S. research base.
Provided by Earth Institute, Columbia University


