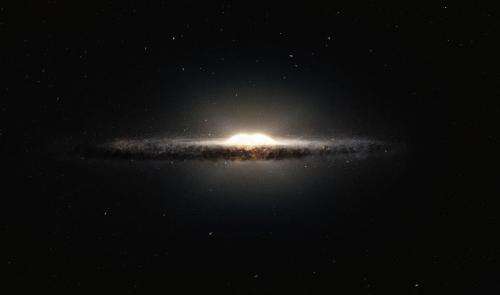
Figures of eight and peanut shells: How stars move at the center of the galaxy

(Phys.org) —Two months ago astronomers created a new 3D map of stars at the center of our galaxy (the Milky Way), showing more clearly than ever the bulge at its core. Previous explanations suggested that the stars that form the bulge are in banana-like orbits, but a paper published this week in Monthly Notices of the Royal Astronomical Society suggests that the stars probably move in peanut-shell or figure of eight-shaped orbits instead.
The difference is important; astronomers develop theories of star motions to not only understand how the stars in our galaxy are moving today but also how our galaxy formed and evolves. The Milky Way is shaped like a spiral, with a region of stars at the center known as the "bar," because of its shape. In the middle of this region, there is a "bulge" that expands out vertically.
In the new work Alice Quillen, professor of astronomy at the University of Rochester, and her collaborators created a mathematical model of what might be happening at the center of the Milky Way. Unlike the solar system where most of the gravitational pull comes from the Sun and is simple to model, it is much harder to describe the gravitational field near the center of the galaxy, where millions of stars, vast clouds of dust, and even dark matter swirl about. In this case, Quillen and her colleagues considered the forces acting on the stars in or near the bulge.
As the stars go round in their orbits, they also move above or below the plane of the bar. When stars cross the plane they get a little push, like a child on a swing. At the resonance point, which is a point a certain distance from the center of the bar, the timing of the pushes on the stars is such that this effect is strong enough to make the stars at this point move up higher above the plane. (It is like when a child on the swing has been pushed a little every time and eventually is swinging higher.) These stars are pushed out from the edge of the bulge.
The resonance at this point means that stars undergo two vertical oscillations for every orbital period. But what is the most likely shape of the orbits in between? The researchers showed through computer simulations that peanut-shell shaped orbits are consistent with the effect of this resonance and could give rise to the observed shape of the bulge, which is also like a peanut-shell.
Next month the European Space Agency will launch the Gaia spacecraft, which is designed to create a 3D map of the stars in the Milky Way and their motions. This 3D map will help astronomers better understand the composition, formation and evolution of our galaxy.
"Gaia will generate huge amounts of data—on billions of stars," said Quillen. This data will allow Quillen and her colleagues to finesse their model further. "This can lead to a better understanding of how the Milky Way might have evolved into the shape it has today."
Quillen explained that there are different models as to how the galactic bulge was formed. Astronomers are interested in finding out how much the bar has slowed down over time and whether the bulge "puffed up all at once or slowly." Understanding the distributions of speeds and directions of motion (velocities) of the stars in the bar and the bulge might help determine this evolution.
"One of the predictions of my model is that there is a sharp difference in the velocity distributions inside and outside the resonance," Quillen said. "Inside—closer to the galactic center—the disk should be puffed up and the stars there would have higher vertical velocities. Gaia will measure the motions of the stars and allow us to look for variations in velocity distributions such as these."
To be able to generate a model for the orbits of stars in the bulge, Quillen needed to factor in different variables. She first needed to understand what happens at the region of the resonance, which depends on the speed of the rotating bar and the mass density of the bar.
"Before I could model the orbits, I needed the answer to what I thought was a simple question: what is the distribution of material in the inner galaxy?" Quillen said. "But this wasn't something I could just look up. Luckily my collaborator Sanjib Sharma was able to help out."
Sharma worked out how the speed of circular orbits changed with distance from the galactic center (called the rotation curve). Using this information, Quillen could compute a mass density at the location of the resonance, which she needed for her model.
Quillen was also able to combine the new orbit models with the speed of the bar (which is rotating) to get a more refined estimate of the mass density 3,000 light-years from the galaxy center (about one eighth of the distance from the center of the galaxy to Earth), which is where the edge of the bulge is.
And there is not long now to wait now for Gaia to start collecting data. Gaia's launch time is set for December 19, and liftoff will be streamed live on the ESA Portal.
More information: "A Vertical Resonance Heating Model for X- or Peanut-Shaped Galactic Bulges," Monthly Notices of the Royal Astronomical Society, Alice C. Quillen, in press. Preprint: arxiv.org/abs/1307.8441
Journal information: Monthly Notices of the Royal Astronomical Society


