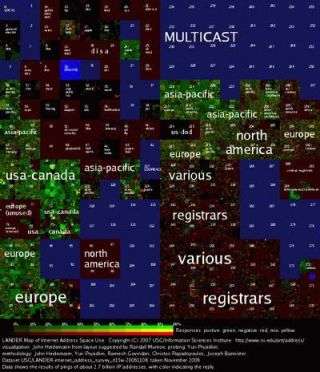
Complete Internet census taken -- perhaps the first since 1982

Researchers at the University of Southern California Information Sciences Institute, one of the birthplaces of the Internet decades ago, have just completed and plotted a comprehensive census of all of the more 2.8 million allocated addresses on the Internet -- the first complete effort of its kind in more than two decades, they say.
"An Internet Census," explains John Heidemannn, an ISI project leader who also has an appointment in the USC Viterbi School of Engineering computer science department, "is just that: every single assigned address in the entire Internet was sent a probe."
The technical name for an Internet probe, more commonly called a "ping" is an "Internet Control Message Protocol (ICMP) echo request packet." It took some 62 days to send almost 3 billion of these from three machines, an effort carried out by Heidmann's ISI collaborator Yuri Pradkin.
A detailed account of the research is at http://www.isi.edu/ant/address/index.html
Many (61 percent) of the pings received no response at all. Many others got a "do not disturb" or "no information available" response that many network adminstrators program into their routers and firewalls. Some of the non- replies were probably also due to firewalls intentionally blocking the pings. Still, as the census went on, millions of sites did respond, positively and negatively, and a unique internet atlas took shape.
The atlas is not geographic, though geographic areas (North American, Europe, etc) show up on it. Instead, it is numerical, building on the mathematical structure of the Internet address system.
Each internet address is a number between 0 and 2 to the 32nd power (4,294,967,295), usually written in "dotted-decimal notation" as four base-10 numbers separated by periods; for example 128.150.4.107. Each number represents one 8-bit part of the whole address.
These addresses appear in the chart as a grid of squares, each square representing all the addresses beginning with the same first number ("128," in the preceding example). The map is arranged in ascending numerical order, but instead in a looping pattern called a Hilbert curve, which keeps adjacent addresses physically near each other, on chart," but also makes it possible to zoom seamlessly in to show greater detail. "The idea of using a Hilbert curve actually came from a web comic, xkcd," Heidemann said.
The smallest feature the map shows is a singe pixel, which is records averaged responses from some 65,536 (2 to the 16th) addresses. The averaging is conveyed by color coding, with all positive responses showing up as brilliant green, all negative as brilliant red, equal numbers as brilliant yellow, with brilliance decreasing down to dim shades in areas where fewer addresses respond.
But the map presents a census view of the visible Internet. "To our knowledge," said Heidemann," the only other census of the Internet was in 1982," when the Intenet consisted of 315 allocated addresses.
Heidemannn and Pradkin have also plotted a second rendering where each pixel represents a single address. When printed out at laser-printer resolution, this map that literally shows every address in the Internet takes up a 9x9 foot space on a corridor wall in ISI's Marina del Rey campus.
The project is continuing. Heidemann hopes to continue censuses to create not just a snapshot -which is what the current map is - but a dynamic movie of Internet evolution, which can aid in detecting and monitoring trends. He and his collaborators are intensively studying the census results working toward this goal.
While the new census is the first they have visualized. ISI has been taking censuses since 2003, when Praydkin and Joseph Bannister (of ISI) and Ramesh Govindan (of the USC Viterbi School of Engineering, started collecting data. Their hopes were to study the growth of the Internet, and their group is still processing this data to look for trends.
“Internet census data is useful for several reasons”, Heidemannn says. “As the Internet use becomes widespread, we are running out of Internet addresses—good predictions by Geoff Huston suggest all addresses may be allocated as soon as early 2010. The IETF (Internet Engineering Task Force, the technical body that manages the Internet) has anticipated this since the 1990s and designed a new protocol, IPv6, to solve this problem, but deployment has been slow. Our data can help illustrate the need to move forward.”
The census also can improve Internet security. In fact, says Heidemann, the Department of Homeland Security "supported our work with the goal of improving network security," As one example, ISI research Jelena Mirkovicis using the new census data to study how worms spread in the Internet. Other researchers have plotted maps of where cyber-attacks originate.
"There’s also a sense of discovery in these maps," Heidemannn says. "We’ve built a huge Internet and use it every day. Like the far side of the moon, wouldn’t you like to know what it looks like"'
More details about the census project and the full-scale map are at www.isi.edu/ant/address/whole_internet/
Source: University of Southern California


