This article has been reviewed according to Science X's editorial process and policies. Editors have highlighted the following attributes while ensuring the content's credibility:
fact-checked
peer-reviewed publication
proofread
Mapping out key sources of emissions for climate change mitigation

Different regions of the world and different sectors of activity emit various amounts of greenhouse gases and other air pollutants affecting climate change. Knowing the details of these contributions can help policymakers decide where to focus their efforts to meet their targets regarding the Paris Agreement. This treaty, signed in 2015, set goals to limit global warming well below 2°C and pursue efforts to limit the increase to 1.5°C above preindustrial levels, to avoid dangerous impacts of climate change.
Different regions and sectors (i.e., energy, transportation, agriculture) emit different amounts of greenhouse gases and other air pollutants to the atmosphere. Each of these gases interacts with incoming and outgoing heat (or radiation) in different ways, and together they determine the amount of warming (or cooling) and climate change we experience. It is therefore important to understand how these interactions with heat or "radiative forcings" might change between regions and sectors over time, so we can mitigate climate change effectively.
A research team has conducted a study on how these contributions from different regions of the world, sectors or types of climate forcers may vary. Their study covers both the historical contributions and future scenarios that were developed by research groups around the world, with two low forcing targets of 1.9 W/m-2 (radiative forcing corresponding to a temperature increase of 1.5°C) and 2.6 W/m-2 (2°C). The team used a large computational resource to calculate the contributions from different regions, sectors, and climate forcers through a climate model.
The authors state that their analysis is wider than previous studies, adding that no study has yet to assess the contributions from different regions, sectors, and climate forcers at multiple points in the past and the future within a single analytical framework.
Their comprehensive attribution assessment shows that achieving these low forcing levels strongly relies on negative CO2 emissions, related to carbon capture and storage methods, under the future scenarios they evaluated. It also shows that most developing regions and certain sectors, such as housing and transport, can produce larger forcings in 2100 than present, even though they are projected to invest substantial efforts to decarbonize. Lastly, it highlights that China, followed by the US, has a crucial role to play in successfully bringing down the current trajectory to meet these goals.

Regional contributions
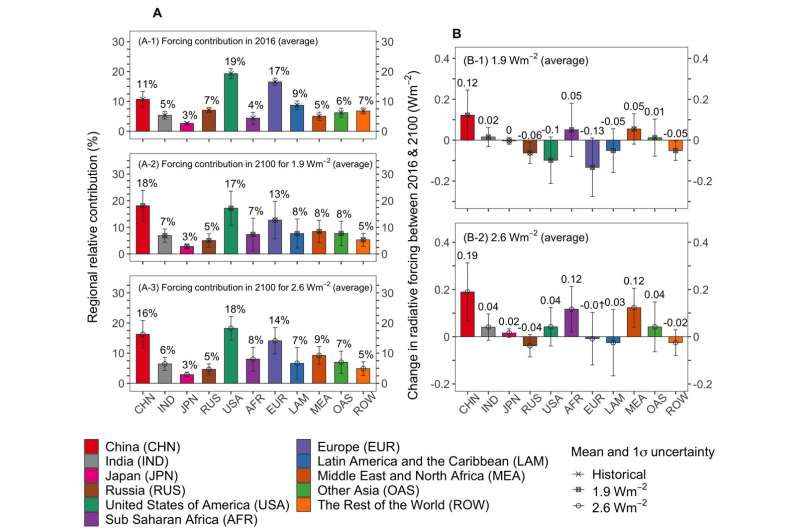
The three regions accounting for nearly half of the total radiative forcing, both for the historical and future scenarios, are the USA, China and the European Union.
While the USA and the European Union shares are projected to decrease in both low forcing scenarios, China's contribution is projected to increase, as for many developing regions (India, Middle East and North Africa, Sub-Saharan Africa and Other Asia).
Sectoral contributions
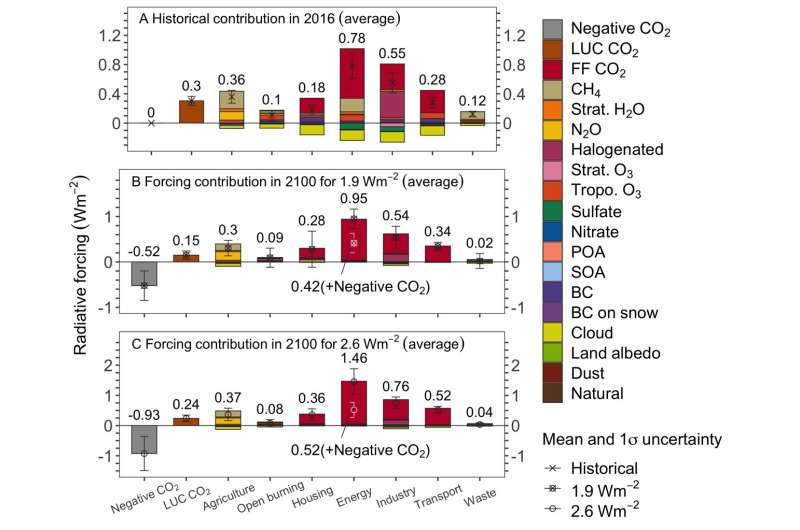
Energy and industry would remain the two main sectors contributing to radiative forcings in both low forcing scenarios. In addition, the negative CO2 emissions would be essential to retain these low forcing levels in 2100, with technologies of carbon capture and storage or BECCS (Bioenergy with carbon capture and storage). The major contribution to radiative forcing is CO2. The researchers state this is related to the life-expectancies of the gases.
The scenarios assume that measures to reduce emissions of air pollutants will continue in the coming decades, and the radiative forcings of methane and tropospheric ozone associated with these measures are relatively short-lived (in decades), leaving little impact in 2100.
However, CO2 is a long-lived gas, and even though strong emission reductions are assumed in the near term under both scenarios, the abated CO2 emissions will still have a strong footprint on radiative forcing at the end of the century. This highlights the need for putting cutting CO2 emissions as the first priority for long-term climate mitigation.
It is interesting to note that the agricultural sector still holds an important share by 2100, reflecting that reducing emissions in this sector (mainly methane and nitrous oxide) would still be a difficult task by the end of the century.
The paper is published in the journal One Earth.
This international study involving research institutes in Japan and France is a comprehensive assessment showing the contribution to radiative forcing by region, sector and climate forcer, both for the historical and future scenarios. It serves as a precious tool to map out how to put efforts efficiently to align on these low forcing scenarios and meet the goals to limit global warming well below 2°C.
More information: Xuanming Su et al, Identifying crucial emission sources under low forcing scenarios by a comprehensive attribution analysis, One Earth (2022). DOI: 10.1016/j.oneear.2022.10.009
Journal information: One Earth
Provided by National Institute for Environmental Studies


