A tale of two extremes: rainfall across the US
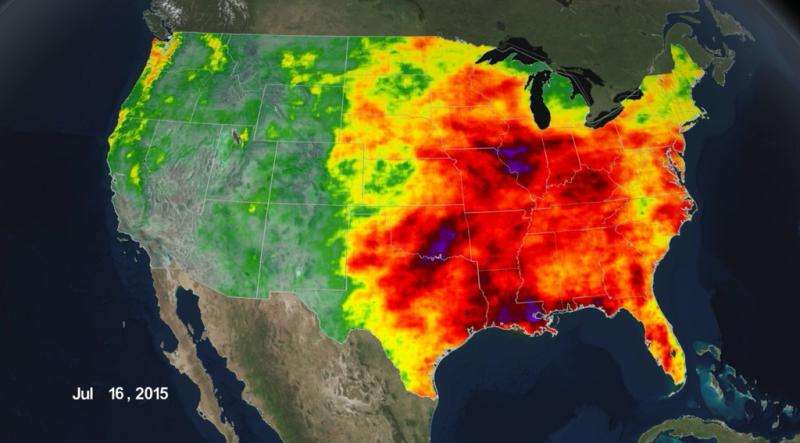
The United States has seen a tale of two extremes this year, with drenching rains in the eastern half of the country and persistent drought in the west. A new visualization of rainfall data collected from space shows the stark contrast between east and west for the first half of 2015.
The precipitation data shown here, from Jan. 1 through July 16, is from the joint NASA-Japan Aerospace Exploration Agency's Global Precipitation Measurement mission. Accumulated rain totals are shown in different colors: 0 to 1 inch is light blue, up to 12 inches is green, up to 20 inches is yellow, and up to 40 inches is red. Purple shows an up to 76 inches in southern Louisiana, central Illinois, and a swath of Texas and Oklahoma that all saw severe flooding associated with heavy rainfall this spring and summer.
From the Rockies westward, rainfall has been much sparser over the last six months. California and the southwest received little relief from their punishing drought. The Pacific northwest has received below average rainfall and not enough snowfall which they, like California, rely on for part of their water supply.
The GPM mission's Core Observatory satellite launched February 2014, and unites precipitation data from an international network of 12 satellites into a single dataset. The result is NASA's Integrated Multi-satellite Retrievals for GPM, or IMERG, data product, which seamlessly shows rain and snowfall across world in 30-minute timesteps.
Provided by NASA


