Third Warmest Year In a Row
Last year was the fourth warmest year on average for our planet since the late 1800s, according to NASA scientists. To determine if the Earth is warming or cooling, scientists look at average temperatures. To get an "average" temperature, scientists take the warmest and the coolest temperatures in a day, and calculate the temperature that is exactly in the middle of those high and low values. This provides an average temperature for a day. These average temperatures are then calculated for spots all over the Earth, over an entire year.
Scientists use temperatures taken on land and on surfaces of the oceans. Weather stations provide land measurements, and satellites provide sea surface temperature measurements over the ocean. These data are computed by NASA. The end result recreates and calculates global temperatures, and helps scientists study climate change. Makiko Sato of NASA's Goddard Institute for Space Studies (GISS), New York, converted all the data into readable global temperature maps that provided the means to see the warming.
James Hansen of NASA GISS analyzed the data and said that the 2004 average temperature at Earth's surface around the world was 0.48 degrees Celsius or 0.86 Fahrenheit above the average temperature from1951 to 1980.
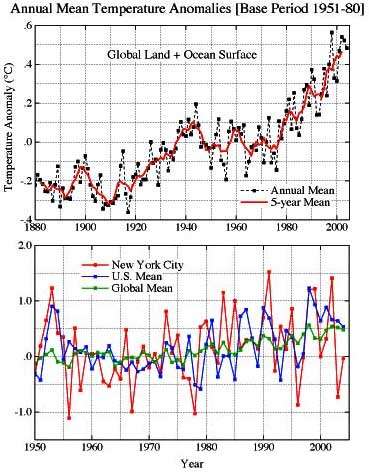
The Warming Trend of Global Surface Temperatures: Trends of annual surface temperature relative to 1951-1980 mean: the global mean is on the top and the global-plus-local means on the bottom. The top panel shows that globally the warmest temperature occurred in 1998 (highest black dot on the top right), while the second and third warmest years were 2002 and 2003, respectively. As the figure shows, there has been a strong warming trend over the past 30 years, a trend shown to be due primarily to increasing greenhouse gases in the atmosphere. Credit: NASA
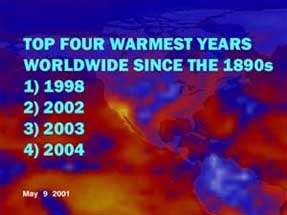
Globally, 1998 has proven to be the warmest year on record, with 2002 and 2003 coming in second and third, respectively. "There has been a strong warming trend over the past 30 years, a trend that has been shown to be due primarily to increasing greenhouse gases in the atmosphere," Hansen said.
Global temperatures vary from year to year and place to place, but weather stations and satellite data provide accurate records. By recording them over time, scientists develop a record of the climate, and have been able to see how it's been changing.
Some of the changes in climate are due to short-term factors like large volcanic eruptions that launched tiny particles of sulfuric acid into the upper atmosphere (stratosphere) in 1963, 1982, and 1991. These natural events can change climate for periods of time ranging from months to a few years. Other natural events, like El Ninos, when warm water spreads over much of the tropical Pacific Ocean, also have large short-term influences on climate. The large spike in global temperature in 1998 was associated with one of the strongest El Ninos of recent centuries, and a weak El Nino contributed to the unusually high 2002-2003 global temperatures.
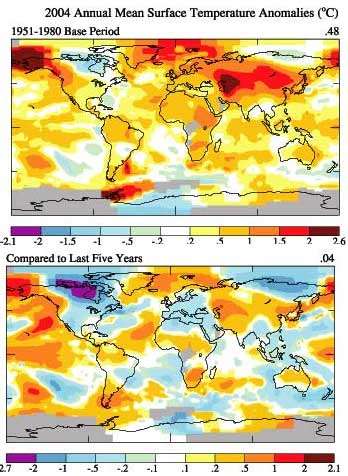
Temperature Comparisons: Left Map: The years of 1951 to 1980 are used as a "baseline" or average for surface temperatures of Earth's land and ocean surfaces. The map on the top is color coded to show the differences from the 2004 temperatures to that period. Yellow to red colorations indicate areas warmer than the 1951-1980 timeframe. Lower Map: 1999-2003 temperatures were matched against the global 2004 temperatures, and the result is that the yellow and red areas were warmer in 2004, while the white and blue areas were cooler.Credit: NASA
Even though big climate events like El Nino affect global temperatures, the increasing role of human-made pollutants plays a big part. Scientists, like Hansen, have been working to try and predict how human impacts on our climate will affect the annual world temperature trends in the future.
Hansen also said that now, Earth's surface absorbs more of the Sun's energy than gets reflected back to space. That extra energy, together with the weak El Nino, is expected to make 2005 warmer than the years of 2003 and 2004 and perhaps even warmer than 1998, which had stood out as far hotter than any year in the preceding century
Another interesting note is that global warming is now large enough that it is beginning to affect seasons, and make them warmer than before on a more consistent basis.
Compared to the average temperatures from the 1951 to 1980 period, the largest unusually warm areas over all of 2004 were in Alaska, near the Caspian Sea, and over the Antarctic Peninsula. But compared to the previous five years, the United States as a whole was quite cool, particularly during the summer.
For the original article by Drs. James Hansen and Makiko Sato, please visit on the Internet: www.giss.nasa.gov/data/update/gistemp/2004/
Source: NASA


