This article has been reviewed according to Science X's editorial process and policies. Editors have highlighted the following attributes while ensuring the content's credibility:
fact-checked
trusted source
proofread
New wage atlas shows more than half of New Yorkers earn below a living wage

A new digital wage atlas launched by Cornell University researchers shows that more than half of New Yorkers earn below a living wage.
The Cornell ILR Wage Atlas is designed to help New York state policymakers, economic development officials, nonprofits, academics and other stakeholders more easily analyze and visualize who earns living wages and where, and which occupations are best or worst for earning a living wage.
The atlas estimates living wages by county based on household size and local costs including food, housing, transportation, childcare, medical care and taxes.
In addition to statewide analyses, the atlas's suite of interactive tools allows users to zoom in on specific neighborhoods, cities or regions and to search wages by race, ethnicity and gender, helping to highlight disparities.
"We hope the wage atlas helps our partners in government and elsewhere better understand patterns of inequality," said Russell Weaver, director of research at the ILR Buffalo Co-Lab. "They can also see which occupations would benefit most from increases to the minimum wage."
Insights about New York's workforce generated by the wage atlas include:
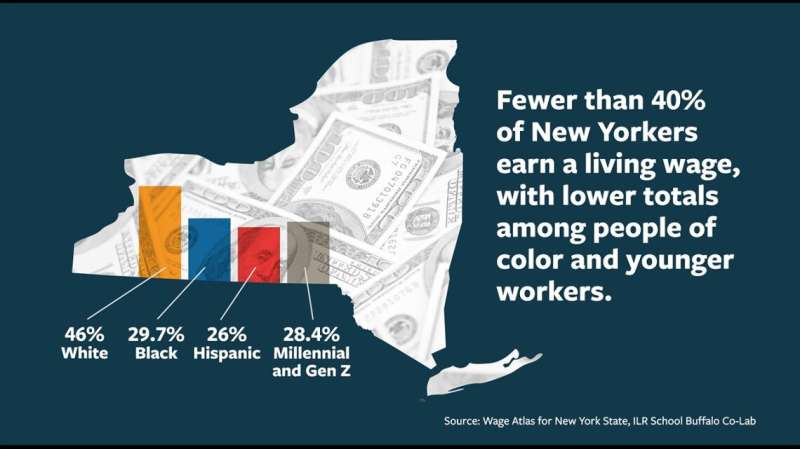
- Across the state, 39.1% of people earn at least a living wage, with white employees (46%) faring significantly better than Black (29.7%) and Hispanic (26%) employees. Among younger workers, 28.4% of those categorized as millennials and Generation Z (born in or after 1981 and 1997, respectively) earn a living wage.
- Accommodation and food services, part of the state's tourism sector, is the industry least likely to pay a living wage, with more than 52% of workers earning less.
- The top 20 jobs for earning a living wage range from podiatrists (81.3%) to plant operators (68.7%). The bottom 20 include cashiers (13.5%), dishwashers (8.3%) and textile machine operators (3.9%).
- Manhattan boasts the state's highest percentage of residents—more than 80%—earning a living wage. But a closer look at New York City presents a picture of economic inequality, with median effective hourly wages ranging from more than $50 in some Manhattan neighborhoods to $20 or less in some nearby communities.
The atlas incorporates information from the Massachusetts Institute of Technology's Living Wage Calculator, which estimates living wages by county based on household size and local costs including food, housing, transportation, childcare, medical care and taxes. For example, the estimated living wage for a single adult with one child in New York County (Manhattan) is $43.18, compared with $33.75 in Onondaga County, which includes Syracuse.
That data is paired with individual-level data from the U.S. Census Bureau's most recent American Community Survey Public Use Microdata Sample, which includes self-reported wages. The researchers matched individuals with their estimated living wage based on their locations, occupations and household characteristics, adjusting all wages for inflation to 2022 dollars.
"To my knowledge, this is the first application of the living wage data to see exactly who is earning at or above that level in a geography, in this case the entire state of New York," Weaver said.
The atlas features five tools that detail wage levels by occupation; the occupations with the highest and lowest percentage of full-time workers earning a living wage; the probability of earning a living wage based on different characteristics; the impact of simulated new minimum wages; and how sub-living wages are linked to demand for social services such as Medicaid and food stamps.
Weaver said the new wage atlas supplements American Community Survey census data that does not offer as fine-grained information on wages by occupation, and state Department of Labor tools limited to wage data provided by employers and not broken down by race, ethnicity or gender.
"The wage atlas provides a fuller picture of what it's like to work in a given occupation and region of New York state," Weaver said.
Weaver plans to update the atlas annually with new census and living wage data and is exploring its expansion to other states.
More information: Atlas: blogs.cornell.edu/livingwage/
Provided by Cornell University


