This article has been reviewed according to Science X's editorial process and policies. Editors have highlighted the following attributes while ensuring the content's credibility:
fact-checked
trusted source
proofread
Research reveals how redlining grades influenced later life expectancy

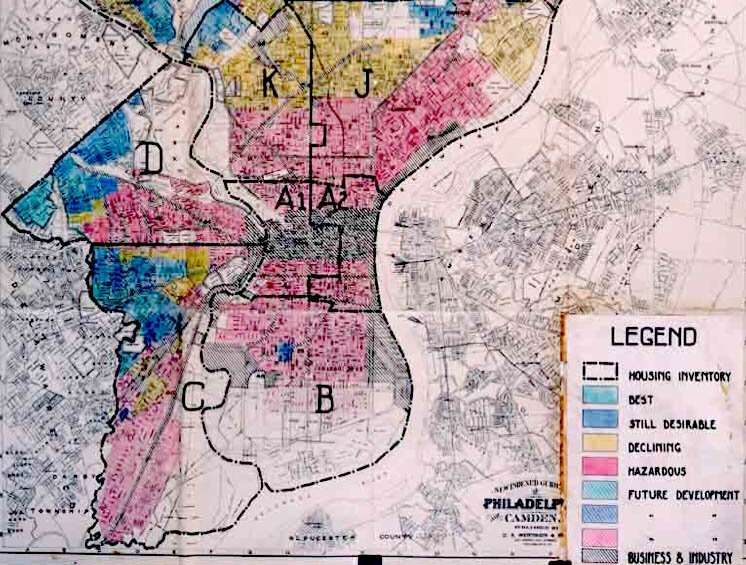
Research from Washington University in St. Louis exposes the deadly legacy of redlining, the 1930s-era New Deal practice that graded neighborhoods by financial risk and solidified the notion that an area's property value was proportional to its racial composition.
Researchers had previously identified a relationship between redlining and population health. Today, residents of areas that were once marked as Grade A "best" generally experience better health than residents of places once coded as Grade D "hazardous," despite decades of intermediate urban change, according to Michael Esposito, an assistant professor of sociology in Arts & Sciences at WashU.
Examples of these health inequality indicators include late-stage cancer diagnosis, preterm birth, asthma-related outcomes, self-rated health and life expectancy.
"The assumption was that life expectancy gaps between differently graded tracts were driven by economic isolation and disparate property valuation that developed within these areas in subsequent decades," Esposito said. "But we lacked an empirical account of how redlining—which formally ended in 1968 with the signing of the Fair Housing Act—continued to impact life expectancy more than 50 years later.
"The research also did not explain why racial disparities also exist in neighborhoods that were never subjected to formal redlining."
Tracing redlining's legacy
Using a causal mediation framework, Esposito and Princeton University's Nick Graetz traced connections between redlining and present-day life expectancy to answer these questions.
Their analysis, which spanned the years from 1930–2018, explores how various factors contribute to disparities in life expectancy. These factors include racialized public-private investment, inequities in property value/distribution and segregation of Black communities, particularly working-class populations. They also studied how work conditions (labor versus professional), access to housing, and access to quality, affordable health care contributed to average life expectancy across neighborhoods.
Published in the sociological research journal Social Forces, their findings show:
- Roughly 30% of the most concentrated Black working-class communities live in areas once graded as D, compared with 13% of white professional-class communities.
- Those in former grade-A neighborhoods live, on average, 5.15 years longer than people living in former grade-D neighborhoods, based on 2018 data.
- Class—specifically Black working class versus white professional—is a stronger indicator of life expectancy differences than former neighborhood grades. The 2018 data showed white professionals live, on average, 9.14 years longer than Black working-class individuals.
"By spatially marking neighborhoods as 'undesirable,' redlining helped to entrench racial segregation, facilitate the infusion of resources into white communities—through access to credit, home equity and public investment—and justify the heaping of hazards on communities of color, particularly Black neighborhoods," the authors write.
Those hazards include exposure to urban renewal projects—which oftentimes displaced communities of color—school segregation, disparate home values, economic isolation and, ultimately, death.
Further, the findings demonstrate that contemporary race-class concentrations are strongly linked to housing valuations, and both are, in turn, strongly linked to life expectancy. To highlight this finding, the authors point to differences between Cleveland and the Dallas/Fort Worth area.
"Cleveland aligns closely with the spatial-marking perspective, where contemporary low home valuation and low life expectancy are almost perfectly distributed along D grades. By contrast, Dallas does not follow this pattern at all, and yet, it is very likely that the Dallas housing market grew out of the same racist logic of redlining to produce equally large, racialized disparities in home valuation and life expectancy," the authors write.
According to Esposito, the evidence is clear: Redlining was not a static historical act of racialized violence, as many people think of it, but rather part of a larger structurally embedded, racialized logic of property valuation that continues to influence the distribution of privileges and risks across neighborhoods, resulting in stark health inequalities.
"Historical redlining grades are no longer a necessary instrument for maintaining the larger racist project of conflating race and risk," he said.
To break this cycle, Esposito and Graetz say we must not only target resources to formerly redlined neighborhoods, but also engage in a larger effort to dismantle racist theories of place value that are deeply embedded in society.
More information: Nick Graetz et al, Historical Redlining and Contemporary Racial Disparities in Neighborhood Life Expectancy, Social Forces (2022). DOI: 10.1093/sf/soac114
Provided by Washington University in St. Louis


