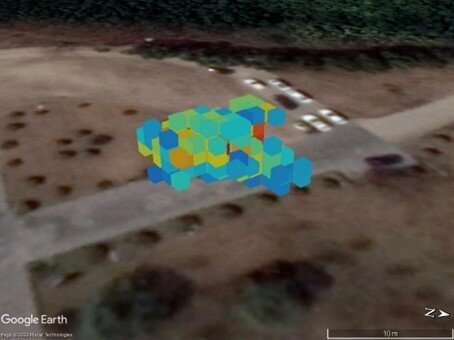
3D image of a leaked gas cloud overlayed on a digital map. The overlay provides detailed information about the leak such as location, volume and concentration, which could be used to provide early warnings, assess risk or determine the best way to fix the leak. Darker red indicates a higher concentration of CH4 within a cloud. Credit: Yunyou Hu, Anhui Institute of Optics and Fine Mechanics, Chinese Academy of Sciences
Researchers have developed a way to create a 3D image of a leaked gas cloud that provides detailed information about the leak such as location, volume and concentration. The new automated detection approach could be used to provide early warnings, assess risk or determine the best way to fix the leak.
"With the rapid development of society, there are now large facilities located around the world where toxic, harmful, flammable and explosive chemicals are being stored," said the research team leader Liang Xu from the Anhui Institute of Optics and Fine Mechanics, Chinese Academy of Sciences. "If there is a leak at one of these facilities, it's important to quickly understand its composition, concentration, location and distribution."
The researchers describe their new method in Optics Express. It combines information from two remote Fourier-transform infrared spectroscopy (FTIR) imaging systems with precise positioning information from GPS and gyroscope sensors to create a 3D image of the gas cloud superimposed on a Google Earth digital map.
"Previously, when leaks occurred, the specific location and direction the gas was moving could not be determined," said Yunyou Hu, first author of the paper. "Our method for creating a 3D reconstruction of a gas cloud can be used to accurately find the latitude and longitude of the leaked gas. This information is important for determining who might be exposed and for quickly stopping the leak so that less gas is released into the atmosphere."
Adding a third dimension
FTIR spectroscopy is widely used in the remote quantitative detection of gaseous pollutants because of its high sensitivity, high resolution and ability to perform real-time measurements with a detection range of about 5 kilometers. However, a single FTIR remote-sensing imaging system only provides 2D information about a gas leak.
To gain a 3D picture, the researchers used two systems to obtain 2D measurements of a gas cloud from different perspectives. This information was then spatially registered with location information obtained using GPS and gyroscope sensors. Putting the data into a computerized tomography imaging algorithm called simultaneous algebraic reconstruction technique (SART) produces a 3D reconstruction of the gas cloud.
"Each voxel, or 3D pixel, in the 3D reconstructed gas cloud contains 3D information about the gas's longitude, latitude, concentration and height relative to the ground," said Hu. "The precise positioning of the monitored space using GPS and gyroscope sensors was key for making 3D quantitative reconstruction of gas clouds possible."
Capturing a gas leak
The researchers tested their method in an outdoor field experiment in which they used two scanning FTIR remote-sensing imaging systems to perform remote monitoring of small amounts of sulfur hexafluoride and methane released over two minutes in a space of about 315 cubic meters. They were able to successfully generate 3D recreations of the gas clouds with longitude, latitude, altitude and concentration distribution for both gases.
"To apply our technique in a real-world scenario, two or more scanning FTIR imaging systems would need to be installed around the monitored area to form a cross-scanning network," said Hu. "Our proposed method could then be used to create a 3D reconstruction of a leaking gas cloud that could, in turn, be used to find the leak source and provide early warning information."
The researchers are now working to optimize the reconstruction method and plan to test the system in real industrial environments.
More information: Yunyou Hu et al, Three-dimensional reconstruction of a leaking gas cloud based on two scanning FTIR remote-sensing imaging systems, Optics Express (2022). DOI: 10.1364/OE.460640
Journal information: Optics Express
Provided by Optica


