Credit: Francesco Ungaro from Pexels
More than 600 fishing vessels sail the icy waters of the Arctic. But just over two dozen big tankers are the worst offenders when it comes to air pollution in this vulnerable region.
In 2021, just 26 natural gas tankers cruised through Arctic waters, as compared to the hundreds of fishing vessels that also ply these rich fishing grounds.
But the giant tankers, which can be 300 meters long or more, account for the largest share of CO2 emissions by far, a new analysis shows. While combined ship traffic in the Arctic region emitted 2.8 million metric tons of CO2 in 2019, the tankers accounted for 788,000 metric tons (almost 28%).
"Even though fishing vessels far outnumber natural gas (LNG) tankers, gas tankers are responsible for nearly 30% of all CO2 emissions from ship traffic in the Arctic," said Ekaterina Kim, an associate professor at NTNU's Department of Marine Technology, who conducted the study. "And the number of tankers operating in the Arctic has increased from 4 to 26 since 2017."
The numbers matter because climate change is shrinking the Arctic ice cover, making it easier for ships to travel along the northern coast of Russia, known as the Northern Sea Route. The most current estimates suggest that most of the Arctic Ocean could become ice-free during the summer as early as 2050.
Any increase in ship traffic will increase the pollutant load in the Arctic, which is one of the most vulnerable environments on the planet. The UN Ocean Decade began last year, with a focus on clean oceans. But as both summer and winter ice cover shrinks, more and more ships of all varieties, including cruise ships and fishing vessels, are finding their way north and increasing their operational season— releasing increasing amounts of CO2 and other air pollutants, Kim said.
Ship traffic and emissions data
Kim conducted her research using Arctic Ship Traffic Data (ASTD), which is collected by the Protection of the Arctic Marine Environment (PAME) group, one of six working groups of the Arctic Council. The Arctic Council is an intergovernmental forum that works on issues facing the eight Arctic nations and indigenous people of the north.
"The overall objective of our team at the Department of Marine Technology is to contribute with new knowledge needed for safety of maritime activities in the Arctic as well as for protection of the Arctic marine environment through reductions in emissions and supervisory risk control," Kim said.
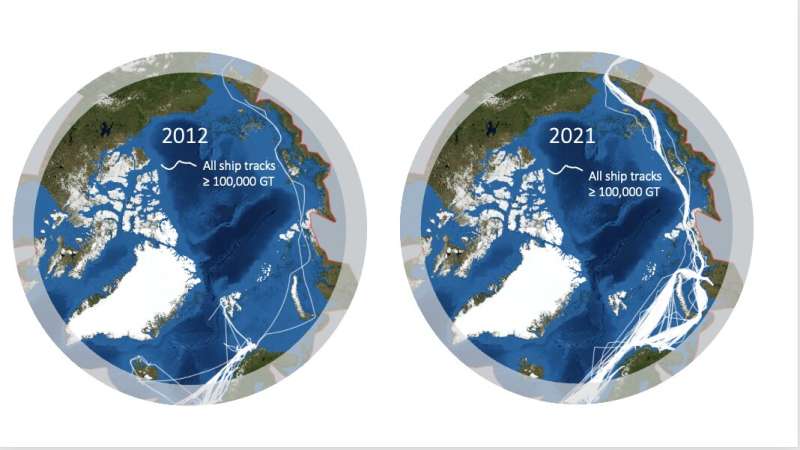
Shipping traffic has increased substantially over the last decade. The white lines on the maps show the actual tracks of ships greater than 100,000 gross tonnage. The maps were made based on data from the Arctic Council Working Group on the Protection of the Arctic Marine Environment’s Arctic Ship Traffic Data (ASTD) System. Credit: Ekaterina Kim, NTNU
PAME reports that shipping in the Arctic increased by 25% between 2013 and 2019. Kim's assessment mainly looked at what is called the Polar Code area. The Polar Code area is defined as the waters north of 60 degrees N, but excluding areas around Iceland, the Norwegian mainland, Russia's Kola Peninsula, the White Sea, the Sea of Okhotsk, and Prince William Sound in Alaska.
During the same period, however, the aggregated nautical miles that vessels traveled in the Polar Code area increased by a whopping 75%, to 10.7 million nautical miles.
Kim has now expanded on this information by analyzing ship type, vessel behavior, and traffic numbers from as recently as 2021, along with emissions data for CO2, oxides of nitrogen (NOx), sulfur dioxide (SO2) and particulate matter (PM) up to 2019.
Increased numbers mean more pollution
Kim said that one of the issues to consider is that as ships get bigger or their number increases, so does pollution.
"We do expect to see numbers drop for sulfur dioxide in some Arctic areas as new regulations reduce the amount of sulfur allowed in ship fuel oil," she said. "However, when it comes to ships using heavy fuel oil there are a number of loopholes that allow individual states to waive some regulations, so we don't know how this will develop."
Pollution from the large gas tankers isn't expected to drastically drop in the Arctic, however, because they use heavy fuel oil, she said, which is not currently covered by the new regulations.
Additionally, the operational season for gas tankers is expanding. ASTD data shows that the gas tankers operate seasonally (mainly from July to November) along the Northern Sea Route, but the window during which they can travel has increased. In 2021, for example, gas tankers also traveled through the NSR in January, February, and December.
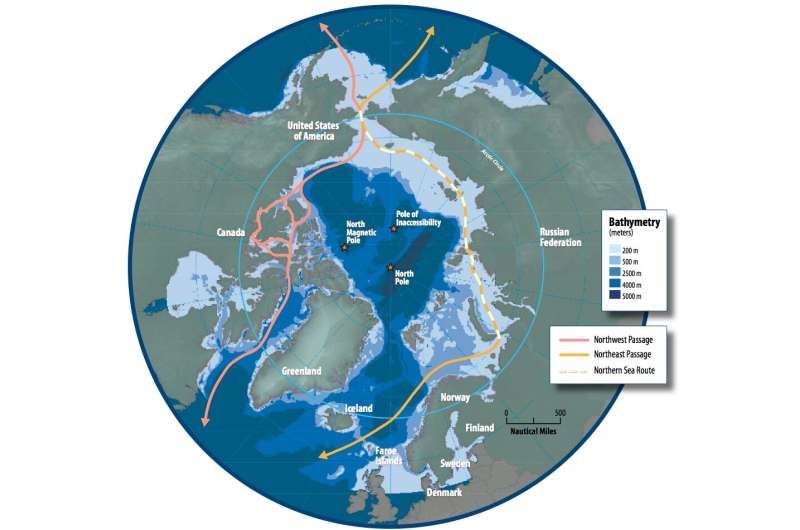
A map showing different routes across the top of the world. The Northern Sea Route, shown to the left, is already in use today. Credit: NOAA
Efficient transport?
The Northern Sea Route along the coast of Russia offers ships traveling from Europe to Asia a shortcut that can be as much as 40% shorter than conventional routes through the Suez Canal, for example. Transit times can also be cut by as much as 10–15 days.
Nevertheless, the NSR still poses some challenges. The ice can be unpredictable, and sometimes ships may need the assistance of an icebreaker or an ice pilot, which can increase costs and transit time. And if the ship runs on any type of fossil fuel, there will be additional CO2 and other emissions associated with the increased transit time.
And even though shipping companies are generally interested in cutting costs, the PAME data show that ships don't travel in ways that always make sense, as Kim discovered when she looked at different shipping tracks.
"You would expect freight transportation to move from A to B via the shortest and (or) safest way. But a detailed study of this behavior shows that ships in the Arctic sometimes move in unusual ways, for no apparent reason," she said.
Kim says these patterns suggest that operations could be optimized to minimize fuel consumption and thus emissions.
"Captains could be given incentives to motivate them operate in a 'greener' way, such as by avoiding unnecessary maneuvers," she said.
Fishing vessels also contribute
With roughly 600 fishing vessels operating in the Polar Code area, it shouldn't be a big surprise that these ships accounted for the biggest share of CO2 emissions before 2017, around the time that the number of LNG tankers really began to expand, Kim said.
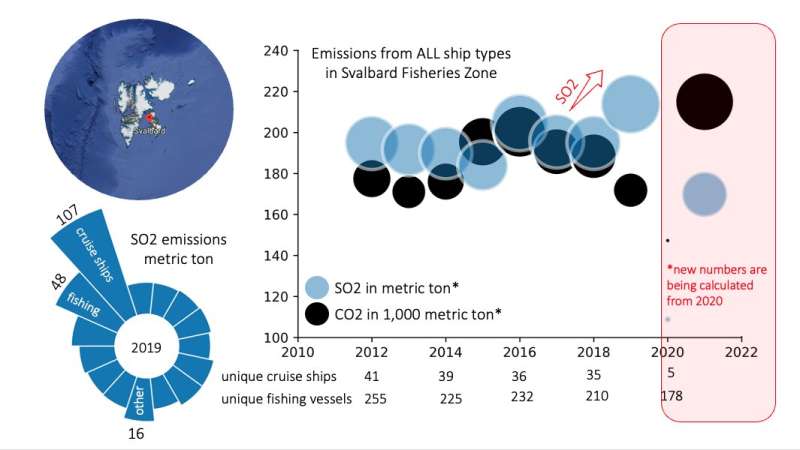
This graphic shows emissions from all ship types from the fishing zone around the Arctic archipelago of Svalbard. Cruise ships accounted for more than double the amount of sulphur dioxide releases up to 2020, when the coronavirus pandemic put a complete halt to cruises to the area. The graphic is based on data from the Arctic Council Working Group on the Protection of the Arctic Marine Environment’s Arctic Ship Traffic Data (ASTD) System. Credit: Ekaterina Kim, NTNU
CO2 emissions from fishing vessels peaked in 2019, with emissions just over 470,000 metric tons, Kim's analysis showed. But in that same year, releases from LNG tankers topped 790,000 metric tons—and this from just 24 tankers.
When Kim looked at emissions from just the Barents Sea Large Marine Ecosystem area, which is off the very northern coast of Norway and Russia, she found that fishing vessels and LNG tankers had similar CO2 emissions in 2019 (557,000 metric tons and 704,000 metric tons, respectively). The Barents Sea area was also the area that that had the highest emissions overall in the entire Polar Code area.
Svalbard is another area where fishing vessels are active. Kim found that while the number of fishing vessels is decreasing, the pollution levels around the archipelago have remained the same because the size of the fishing vessels is increasing, she said.
Kim also says that cruise ship sizes around Svalbard are also increasing, since cruise ship numbers have gone down even though pollution numbers have stayed the same. There was a spike in SO2 emissions in 2019 from these ships, but the advent of the coronavirus meant that no cruise ships traveled to Svalbard in 2020 and only a few in 2021.
Worse in the Baltic Sea
While it's important to reduce Arctic emission levels as much as possible, Kim points out that the overall emissions there are much lower than in more populated areas farther south.
"For example, ASTD data shows that in the Finland and Sweden EEZ (Exclusive Economic Zone), passenger vessels contribute between 600,000 to 700,000 metric tons CO2 every year from 2012–2019," she said. "This is nearly as much as LNG carriers in the Arctic, but is concentrated in much smaller areas."
Kim says, however, that it's important to keep in mind that the Arctic remains relatively pristine compared to more populated areas farther south.
"Shipping in the Arctic brings with it light pollution, noise, marine litter, and more," she said. "Only zero activity has zero pollution."
"Ship traffic and pollution numbers keep rising, and the Arctic is melting fast," she said. "So can regulations keep up with the changes?"
Provided by Norwegian University of Science and Technology


