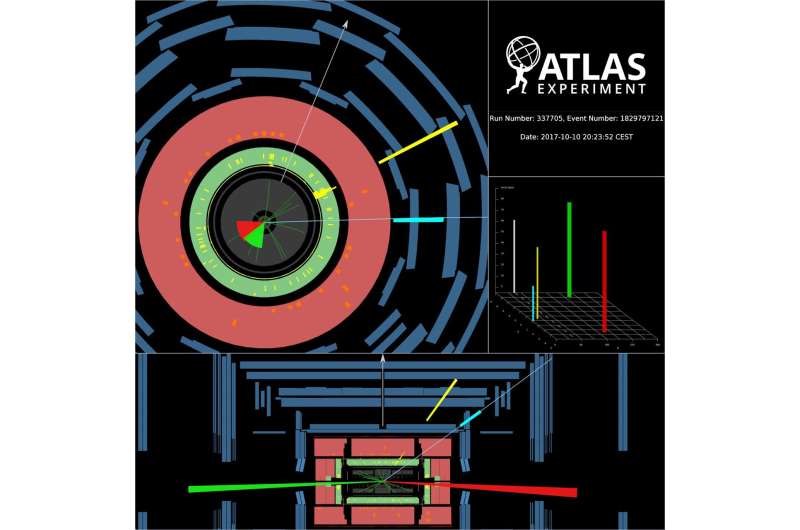
Candidate event for the vector-boson fusion production of a Higgs boson with subsequent decay into leptonically decaying W bosons. The final state particles are an electron (yellow), muon (turquoise) and two forward jets (green and red). The white arrow indicates missing transverse momentum. Credit: ATLAS Collaboration/CERN
Discovering the Higgs boson in 2012 was only the start. Physicists immediately began measuring its properties, an investigation that is still ongoing as they try to unravel if the Higgs mechanism is realized in nature as predicted by the Standard Model of particle physics. Earlier this spring, researchers at CERN's ATLAS Experiment announced they had measured the Higgs boson in its decays to W bosons. W bosons are particularly interesting in this context, as the properties of their self-interaction (vector boson scattering) gave credibility to the mechanism that predicted the Higgs boson.
The Higgs bosons produced at the Large Hadron Collider (LHC) live a very short life of just 10-22 seconds before they decay. They reveal their properties to the outside world twice: during their production and their decay. ATLAS' new result studied the Higgs boson at both of these moments, looking at its production via two different methods and its subsequent decay into two W bosons (H➝WW*). As one in five Higgs bosons decays into W bosons, it is the ideal channel to study its coupling to vector bosons. Researchers also focused on the most common ways to produce the famed particle, via gluon fusion (ggF) and vector-boson fusion (VBF).
The Avocado measurement
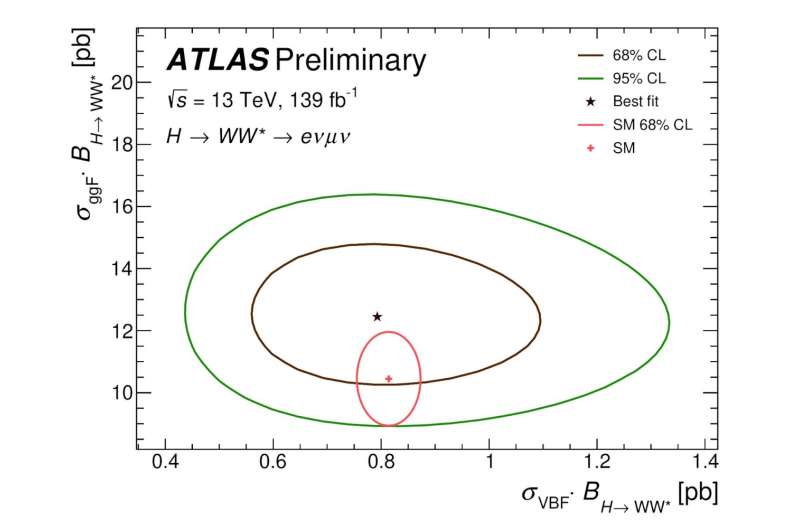
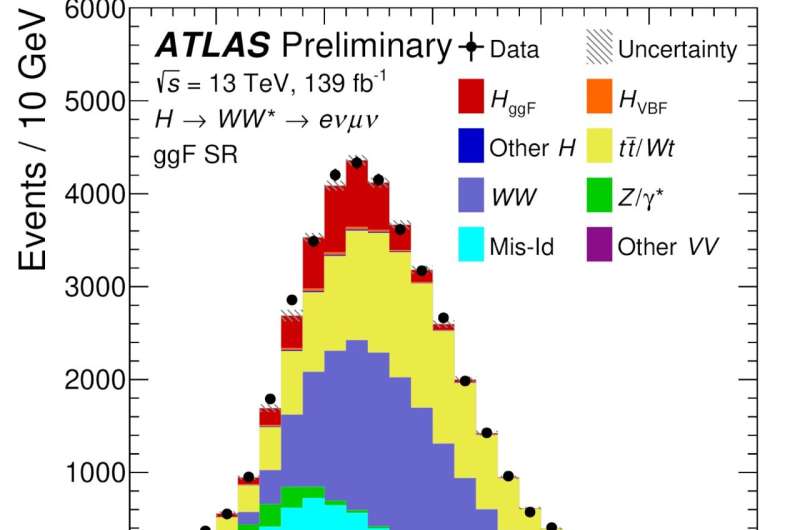
ATLAS physicists have quantified how often the Higgs boson interacts with W bosons. After comparing their measurement and simulation in a histogram in order to demonstrate that they could model the data accurately (see Figure 3), the researchers carried out a statistical analysis of the processes' cross section. The result is displayed in Figure 2, where the ggF and VBF production modes are shown separately on the two axes. The ATLAS result is denoted with a star, and is surrounded by brown and green bands that represent the uncertainties. If the analysis were to be repeated many times on different data, 68 or 95% of these repetitions should fall within the enclosed bands.
This lovingly baptized 'Avocado plot' not only illustrates the experimental results, but also the prediction by the Standard Model (shown with a red cross). This indicates that the measurement result is in good agreement with the theoretical prediction. If a larger deviation between experiment and theory were seen, it could hint towards currently unknown phenomena. Even though the Standard Model is well established, it is known to be incomplete, which motivates to search for such discrepancies.
Figure 2: Cross section measurement of Higgs boson production via the gluon fusion (y axis) and vector-boson fusion (x axis) process. The star displays the measurement value and the cross the value predicted by the Standard Model (circled by a line indicating the theoretical uncertainty). Both agree well within the uncertainties. Credit: ATLAS Collaboration/CERN
The new player
Physicists have only recently been able to confirm that the VBF production mode also contributes to the H➝WW* process. Now, analysers have improved their result significantly by using a neural network—the same technique that allows computers to identify people on images. Using this neural network, they were able to dramatically improve the separation of VBF events from the more frequent ggF ones and from other background contributions.
Among the few dozen events whose properties are very compatible with the VBF production of the Higgs boson, the researchers selected one to showcase how these events look in the detector (see event display). The VBF production mode stands out due to the two well separated jets of hadrons reaching the forward regions of the ATLAS detector. They recoil against the decay particles of the W bosons: the electron and muon.
Figure 3: Selected data events for the ggF production mode are compared to predictions as a function of transverse mass of the Higgs boson. The Higgs boson signal is shown in red over the background of mainly top quark (yellow) and WW (violet) production. The middle panel shows the ratio of data to the sum of all simulations, whilst the bottom panel compares the data to the sum of all predictions. Credit: ATLAS Collaboration/CERN
What's in store in the long run?
From an experimental point of view, it makes sense to analyze the Higgs boson according to how it decays in the detector, probing the characteristics of the decay precisely. But in order to measure properties of the production mode, different decay-focussed analyses need to be combined. To streamline this process, physicists use simplified template cross sections (STXS). This categorizes particle collisions according to properties associated with the production mode, thus allowing physicists to measure all of the event rates individually. Because the categorisation is standardized between analyses and even between experiments, later combinations are facilitated.
Despite the remarkable improvements of this new result, the true power of the STXS approach will become apparent in combinations with other analyses. ATLAS produced a STXS combination last year, and the next iteration will benefit from the power of this new H➝WW* measurement.
More information: Measurements of gluon fusion and vector-boson-fusion production of the Higgs boson in H→WW*→eνμν decays using proton-proton collisions at 13 TeV with the ATLAS detector (ATLAS-CONF-2021-014): atlas.web.cern.ch/Atlas/GROUPS … ATLAS-CONF-2021-014/
Provided by ATLAS Experiment


