Monitoring methane emissions from gas pipelines

For the first time, scientists, using satellite data from the Copernicus Sentinel missions, are now able to detect individual methane plumes leaking from natural gas pipelines around the globe.
Methane is one of the most potent greenhouse gases, second only to carbon dioxide in its overall contribution to climate change. The energy sector, including oil, natural gas and coal, is one of the largest sources of methane emissions. According to the International Energy Agency (IEA), oil and gas operations worldwide emitted just over 70 Mt of methane into the atmosphere in 2020 alone.
Until recently, the debate surrounding methane emissions during natural gas transportation has been focused on defective installations and devices resulting in small, 'fugitive' or unintended emissions. Thanks to powerful technologies, such as high-resolution satellite data, scientists are now able to underline the impact of frequent and intentional methane releases, also known as 'venting."
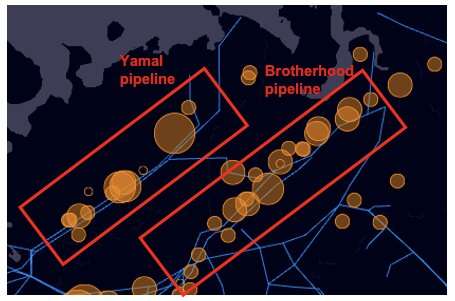
In 2020, Kayrros, a European technology start-up, successfully developed a tool to accurately detect individual methane emissions from space. Now, the platform is being used to track regular methane emissions along gas pipelines, for example in Siberia, with emission rates of up to 300 tons per hour recorded.

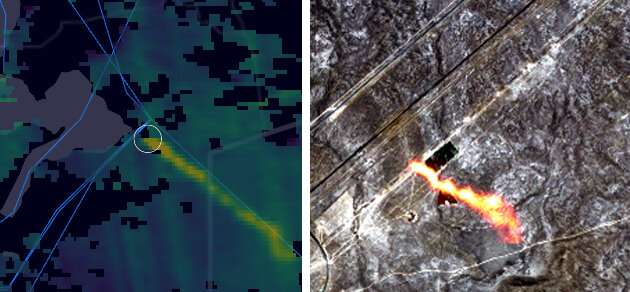
By combining data from the Copernicus Sentinel-5P and Sentinel-2 missions, along with artificial intelligence algorithms, Kayrros scientists detected 13 methane emission events, with rates up to 164 tons per hour in 2019-2020, along the Yamal-Europe pipeline—a 4196 km pipeline running across Russia, Belarus, Poland and Germany.
Another 33 emission events, with rates up to 291 tons per hour, were detected over the same period on the shorter, Brotherhood pipeline. When contacted, operators confirmed that these events were related to planned maintenance and have been duly reported to the relevant authorities.
Remarkably, the number of emission events detected by Kayrros increased by 40% over Russia in 2020 from 2019, even though the COVID-19 pandemic helped cut Russian gas exports to Europe by an estimated 14%, according to the IEA.

Over the same period, Kayrros also detected major methane releases in the US, from numerous emissions associated with shale oil production, as well as in other countries such as Kazakhstan.
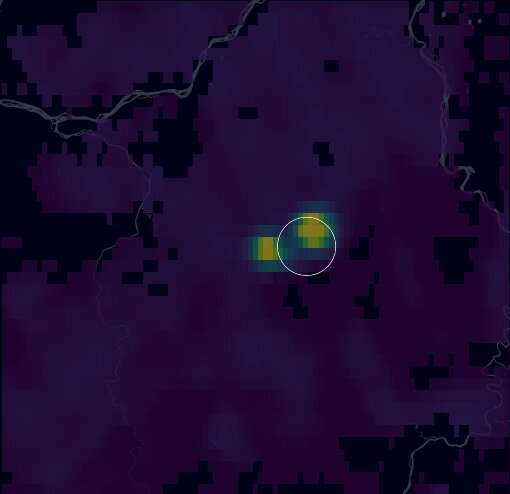
Many methane emissions take place during transportation, as operators choose to vent the gas during routine maintenance operations, which sometimes results in a 'double-cloud' pattern on Sentinel-5P images. These events, however, could easily and cost-effectively be avoided by using alternative operational practices such as portable flaring.
Antoine Rostand, President of Kayrros, said, "The climate footprint of these operational practices is enormous because of the global warming potential of methane—84 times greater than carbon dioxide over 20 years. The venting observed by Kayrros along Russian pipelines in 2019 and 2020 released methane equivalent to approximately 3 Mt of carbon dioxide, which could have been avoided."

"We now have the technology to align with our ambitions. It's time to use it."
ESA's Copernicus Sentinel-5P Mission Manager, Claus Zehner, commented, "Kayrros' use of Copernicus Sentinel-2 and Sentinel-5P images to detect methane hotspots is not only a major technical achievement but is hugely beneficial for the planet. It shows how cutting-edge innovation can leverage data from the Copernicus programs to deliver benefits beyond what could have been imagined when these programs were initially launched."
Provided by European Space Agency


