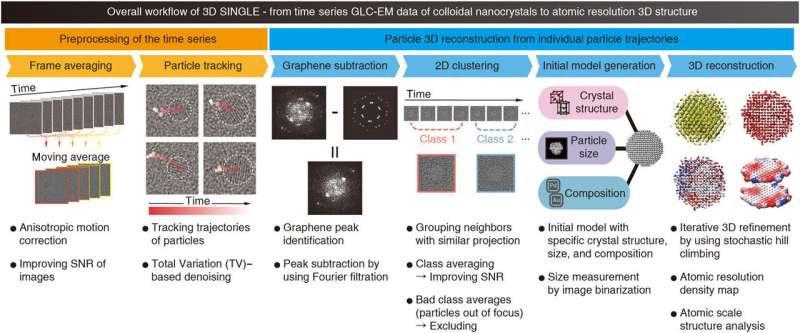
Overall workflow of SINGLE. Overall workflow and descriptions of each step of SINGLE are shown. SINGLE consists of two major steps: Preprocessing of the time series (orange), including (i) time-window frame averaging with anisotropic motion correction and (ii) tracking particle trajectory with using total variation (TV)–based denoising, and particle 3D reconstruction from individual particle trajectories (blue), including (i) graphene background identification and subtraction, (ii) time-restrained 2D clustering with exclusion of out-of-focus images, (iii) initial model generation, and (iv) 3D reconstruction and atomic-scale structure analysis. Credit: Science Advances, doi: 10.1126/sciadv.abe6679
Materials scientists typically use solution-phase transmission electron microscopy (TEM) to reveal the unique physiochemical properties of three-dimensional (3-D) structures of nanocrystals. In a new report on Science Advances, Cyril F. Reboul and a research team at the Monash University, Australia, Seoul National University, South Korea, and the Lawrence Berkeley National Laboratory U.S., developed a single-particle Brownian 3-D reconstruction method. To accomplish this, they imaged ensembles of colloidal nanocrystals using graphene liquid cell transmission electron microscopy. The team obtained projection images of differently rotated nanocrystals using a direct electron detector to obtain an ensemble of 3-D reconstructions. In this work, they introduced computational methods to successfully reconstruct 3-D nanocrystals at atomic resolution and accomplished this by tracking individual particles throughout time, while subtracting the interfering background. The method could also identify/reject low-quality images to facilitate tailored strategies for 2-D/3-D alignment that differed from those in biological cryo-electron microscopy. The team made the developments available through an open-source software package known as SINGLE. The free software is available on GitHub.
Using SINGLE for Crystallography
Researchers have sustained advances in crystallography in the past 50 years to transform the existing understanding of chemistry and biology. Nevertheless, some targets including solubilized nanocrystals remain intractable to traditional crystallographic methods. For instance, colloidal nanocrystals contain tens to hundreds of atoms and maintain a variety of applications across multidisciplinary fields including electronics, catalysis and biological sensors. The versatilities arise from the high sensitivity of nanocrystal properties to size, chemical composition and other variables during synthesis. Typically, scientists use single-particle, 3-D reconstruction in structural biology to determine the structure of proteins. The technique is relatively new for in-situ 3-D reconstruction of solubilized individual nanocrystals. In this work, Reboul et al. developed SINGLE; a method that relied on the independent 3-D reconstruction of solubilized individual nanocrystals including Brownian motion. The technique is a first-in-study advancement to resolve 3-D atomic structures of nanocrystals directly from the solution phase.
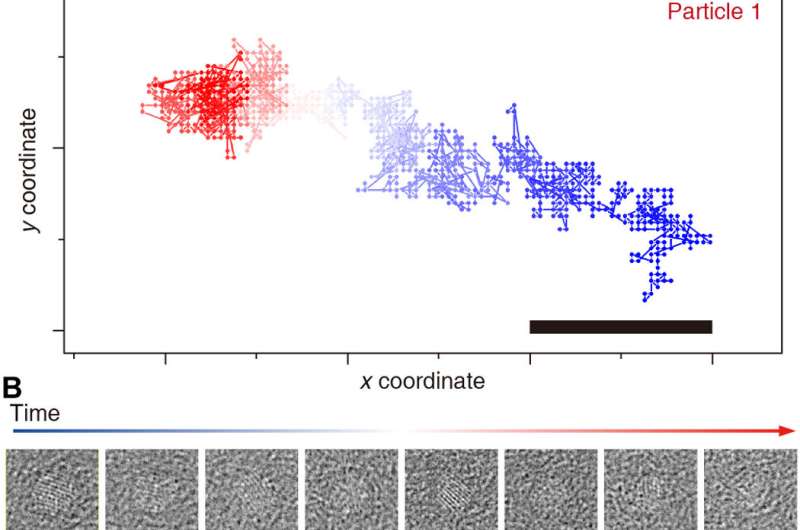
Tracking of individual nanocrystal trajectories. Tracking results of particle 1 (A and B) and 2 (C and D) throughout the movie (blue to red). Representative time averages of raw unaligned particle images (50 frames) are shown (B and D). Scale bars, 1 nm. Credit: Science Advances, doi: 10.1126/sciadv.abe6679
Overview and workflow of SINGLE
The scientists introduced new pre-processing methods to improve the signal-to-noise (SNR) ratio to track the particle trajectories while removing graphene-induced background signal. Advanced computational methods could successfully 3-D reconstruct from the in-situ graphene liquid cell (GLC) transmission electron microscopy data. Compared to existing techniques, the work presented the applicability of an unprecedented computational method to obtain 3-D reconstructions at atomic-resolution for nanocrystals dispersed in solution. They divided the SINGLE workflow into two major steps (1) preprocessing and (2) particle 3-D reconstruction. The scientists aimed to provide the highest possible performance and efficiency on any CPU hardware, including supercomputers to workstations or even laptops.
At first, the team averaged the time-window across several frames with anisotropic motion to improve the signal-to-noise ratio, leading to visible particles and an enhanced graphene signal. The team then identified the particle positions manually in the first time-window average. Thereafter, the team developed a starting model based on the expected crystallographic structure, particle diameter and constituent elements and produced 3-D reconstructions with fitted atomic coordinates for structure analysis at the atomic scale.
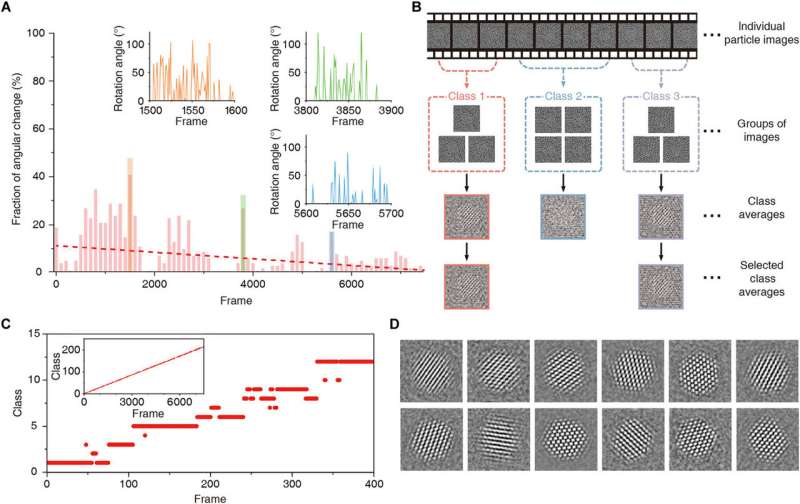
Time-restrained 2D clustering. (A) Fraction of angular change throughout the time series. Red dashed line is the trend line. Projection directions are changing rapidly in the regions between frames 1500 to 1600 (orange), frames 3800 to 3900 (green), and frames 5600 to 5700 (blue). Insets are plots depicting angular difference in projection direction in those regions. (B) Schematic depiction of time-restrained 2D class averaging. (C) Plot showing allocated classes for individual frames in the 1 to 400 region. Inset is plot showing allocated classes over all frames. (D) Class averages obtained with time-restrained 2D clustering and alignment. Credit: Science Advances, doi: 10.1126/sciadv.abe6679
Tracking individual particles through time
Reboul et al. introduced a new tracking method using fast Fourier transforms and the phase correlation to identify a correlation maximum with sub-pixel accuracy. The team denoised the extraction time window using total variation (TV)-based denoising and combined denoising and time averaging to provide a robust method to track the motion of individual nanocrystals throughout the sample. The method allowed them to discern the overall shape of the nanocrystals and/or their crystalline features—which attested to the robustness of the tracking algorithm. Using the method, they also recovered previously challenging trajectories to obtain 3-D reconstructions and employed a background-subtracted particle trajectory in all image processing steps for graphene subtraction of the GLC (graphene liquid cell). The team further characterized the nature of nanocrystal rotations in the highly confined space of the graphene liquid cell. The method was nontrivial due to the probabilistic nature of the 3-D reconstruction algorithm. The team therefore incorporated a deterministic approach to improve the accuracy of the cluster, while improving the signal-to-noise ratio versus the individual frames.
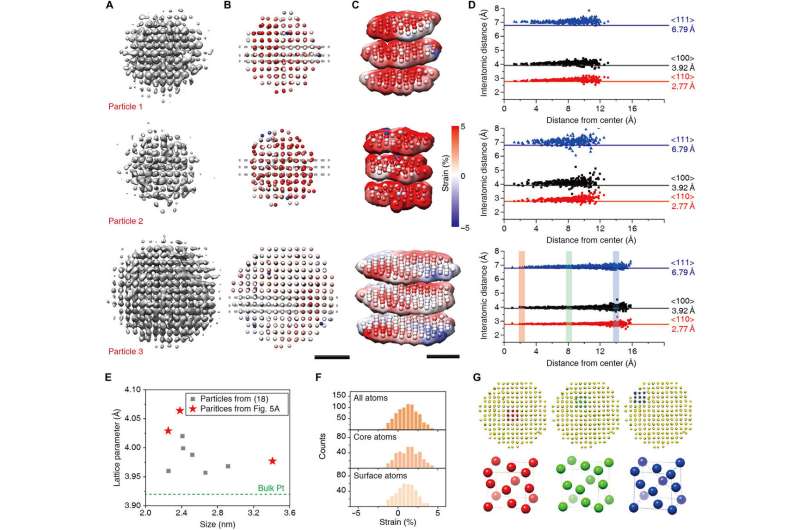
3D reconstruction results and atomic level structure analysis. (A to C) 3D density maps (A), radial strain maps from fitted atomic coordinates (B), and their slice representation (C). (D) Interatomic distances in the directions of <110> (red), <100> (black), and < 111> (blue) for three nanocrystals. (E) Fitted lattice parameters of previously reported nanocrystals (18) (gray squares) and new results (red stars). (F) Histogram of radial strain of all atoms (top), core atoms (middle), surface atoms (bottom) of particle 3. (G) Unit cell structure of core (red), middle (green), and surface (blue) of particle 3. Scale bars, 1 nm. Credit: Science Advances, doi: 10.1126/sciadv.abe6679
Generating models
The researchers next developed a starting model using the knowledge that particles have an approximately cubic atomic position arrangement. They simulated the atomic densities using 5-Gaussian atomic scattering factors. The 2-D projections of the simulated 3-D density represented the character of projections in the core of the nanocrystal, to overcome issues related to translational symmetry and an interfering background signal. The 3-D refinement method in use for biological cryo-electron microscopy could not be straightforwardly applied to time series data of nanocrystals; therefore, Reboul et al. introduced critical modifications. They used a two-stage refinement scheme to establish the correct shape of the nanocrystal to allow atoms and their shapes to drive 3-D alignment. The researchers chose three nanocrystals of varying sizes that were not previously reconstructed for benchmarking, then using atomic maps produced with the method, Reboul et al. obtained microscopic structural details at the atomic level. The work also facilitated atomic maps detailing strain analysis and unit cell structure analysis.
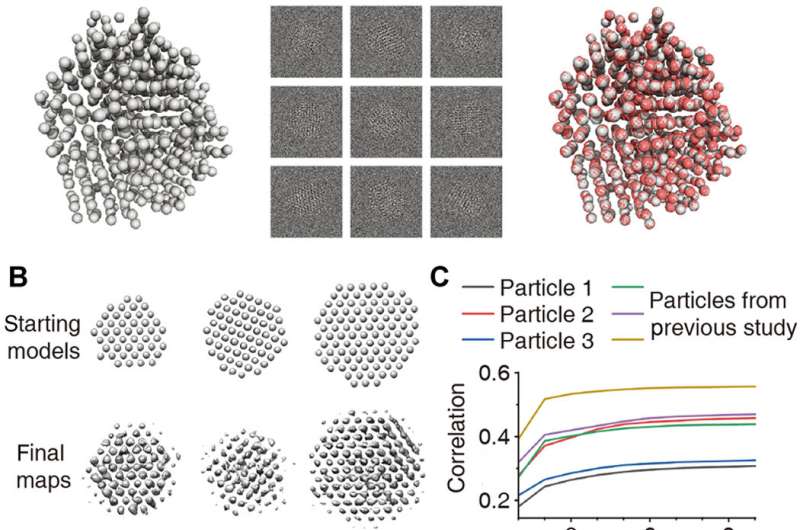
Validation of 3D reconstructions. (A) 3D reconstruction of simulated disordered particle with known atomic structure. Left: Model of a disordered nanocrystal obtained by molecular dynamics simulation. Middle: 5000 multislice simulated images with noise added to give a SNR = 0.1. Right: Atomic map (red) as result of 3D reconstruction overlaid with the ground truth model (gray). (B) Starting 3D models and final 3D density maps obtained from experimental data. (C) Correlation between reprojections of the refined 3D density map and the experimental particle views plotted as a function of iteration for the first stage of 3D refinement. Particles presented in this paper (black, red, and blue color) and presented in a previous study (18) (green, purple, and ocher color) are plotted. (D) Comparison of class averages (indicated as projection) with reprojections for validation of the three structures. (E) Time-dependent atomic representation of the projection directions for the three structures: white (beginning) to pink (middle) to red (end). Red, yellow, and blue arrows indicate x, y, and z axes, respectively. Credit: Science Advances, doi: 10.1126/sciadv.abe6679
Validating the 3-D reconstructions
The researchers further generated a model of a disordered nanocrystal using molecular dynamics simulations to understand the applicability of SINGLE to highly disordered nanocrystals. Using multi-slice simulations, they applied translational motion and random defocus variations to represent realistic particle motion. They then obtained a 3-D density map of the disordered nanocrystal from 500 simulated images with a signal-to-noise ratio of 0.1 and a starting model with perfect crystalline order to agree excellently with the original particles. The team obtained the distribution of the projection directions of the rotating nanocrystals to validate the quality of the 3-D reconstruction and will require further studies to understand how the actual atomic structures of nanocrystals affect rotational dynamics.
In this way, Cyril F. Reboul and colleagues demonstrated computational methods in SINGLE to obtain atomic-resolution nanocrystal density maps. Using an advanced liquid cell configuration such as graphene liquid cells with ordered nanochambers, the team allowed control of the liquid thickness to extend the applicability of SINGLE for efficient data acquisition. The SINGLE suite provided a first-in-study efficient analytical platform to understand the structural origin of the unique physical and chemical properties of nanocrystals in their native solution phase.
More information: Reboul C. F. et al. SINGLE: Atomic-resolution structure identification of nanocrystals by graphene liquid cell EM, Science Advances, DOI: 10.1126/sciadv.abe6679
Baldi A. et al. In situ detection of hydrogen-induced phase transitions in individual palladium nanocrystals. Nature Materials, doi.org/10.1038/nmat4086
Park J. et al. Nanoparticle imaging. 3D structure of individual nanocrystals in solution by electron microscopy. Science, 10.1126/science.aab1343
Journal information: Science Advances , Nature Materials , Science
© 2021 Science X Network
