Interactive map will crowdsource hate crime reports

Los Angeles County recorded 524 hate crimes reported in 2019, the most since 2009. And although the annual number of hate crimes is far less than its recent peak of 1,031 in 2001, the figures have trended upward over the past six years, according to data published Oct. 23 by the Los Angeles County Commission on Human Relations.
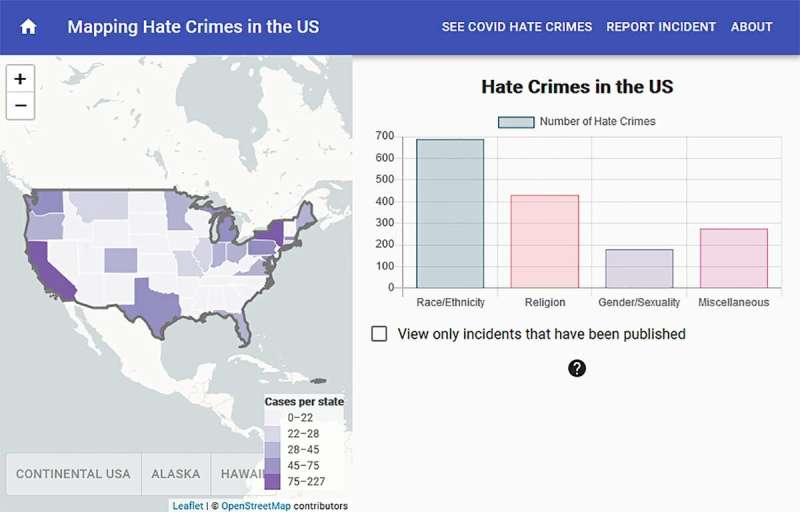
Now, the UCLA American Indian Studies Center has launched an online interactive hate crime map to help track such incidents across the U.S. The new website is intended to supplement reporting on such crimes, both by inviting submissions from people who have experienced such crimes and by tracking published accounts from news sources.
The scope of hate crimes is difficult to quantify because definitions often vary from jurisdiction to jurisdiction, and incidents are widely under-reported—in part because police departments may be reluctant to designate incidents as hate crimes. Los Angeles County officials, for example, estimate that about half of hate crimes go unreported.
"Our purpose in working on the map is to empower our communities and raise awareness around the reality of hate speech and hate acts," said Shannon Speed, director of the center, and a UCLA professor of anthropology and gender studies. "Ultimately, we hope it contributes to ending hate crimes against anyone. We know people of color have been victims of hate crimes for a long time, and we want to shine a light on this in a way that gives victims a means to share their experiences when they might otherwise not feel safe to do so."
The site enables users to hover over a U.S. state and view a total number of incidents along with breakdowns for the number of crimes that targeted the victim based on their race, religion or sexual identity. It currently presents data from January 2017 through October 2020, based on incidents reported in newspapers across the country and by ProPublica and the Stop AAPI Hate Reporting Center, which tracks crimes against Asian American and Pacific Islander communities.
According to the recent Commission on Human Relations report, hate crimes in Los Angeles county are most often committed against Jewish, transgender and Black people. Hate crimes containing evidence of white supremacist ideology increased by 38% from 2018 to 2019. And the severity of the crimes appears to be worsening: 65% of hate crimes in 2019 were classified as "violent," up from 61% a year earlier.
The map links to reports about the hate crimes—on news websites and social media—so that it not only provides statistics but also shares relevant stories.
The map enables victims to identify their own racial, ethnic, gender and religious identities. That approach was informed by a lesson from UCLA's Million Dollar Hoods project, which revealed that police frequently assign inaccurate racial and ethnic identities to people who are incarcerated.
"We want to send the message that it's not just the black-and-white numbers that count," Speed said. "We believe that the value of the map lies in its ability to tell a story from the victim's perspective, which will augment official data. And we want to emphasize that even one attack is too many."
The website also includes data gathered during the COVID-19 pandemic by Stop AAPI Hate, which since mid-March has tracked nearly 2,700 incidents of attacks and harassment directed at Asian Americans and Pacific Islanders. The site enables visitors to read firsthand accounts of those incidents from observers or victims. The center's staff hopes that as the database grows, the accounts could help public officials and advocacy programs decide where legal aid, anti-hate programs and public messaging campaigns would be most effective.
Because of how the site sources its reports, it will likely cover only a fraction of the hate crimes actually committed nationwide. But Speed said the team behind the map has already enlisted support from all of UCLA's ethnic studies centers, is pursuing collaborations with social justice organizations and will continue to comb through published accounts in an effort to make the map as complete as possible. It also plans to seek funding sources that will enable the project to gather more comprehensive crime data from local and state jurisdictions.
The site's creators hope that over time, researchers and journalists will be able to use it to better track the issues and stories around hate crimes.
The map was designed by Albert Kochaphum, a staff member in UCLA's Institute for Digital Research & Education and an expert in geographic information system, or GIS, mapping. He supervised the work of Chris Lam, a UCLA undergrad who works in the UCLA College Social Sciences computing department. Research assistants hired by AISC combed through online news databases to compile the original dataset.
More information: Hate Crime Report: hrc.lacounty.gov/wp-content/up … ate-Crime-Report.pdf
Provided by University of California, Los Angeles


