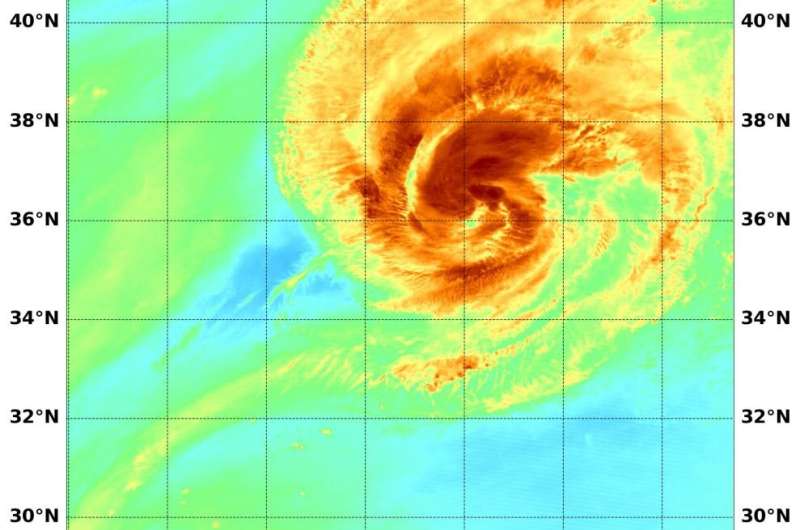
Water vapor imagery reveals hurricane Paulette's strongest side, dry air

NASA's Aqua satellite analyzed Hurricane Paulette's water vapor content as it continued to move away from Bermuda and found structural changes, the strongest side, and dry air moving in.
Water vapor imagery's indications
Water vapor analysis of tropical cyclones tells forecasters how much potential a storm has to develop. Water vapor releases latent heat as it condenses into liquid. That liquid becomes clouds and thunderstorms that make up a tropical cyclone. Temperature is important when trying to understand how strong storms can be. The higher the cloud tops, the colder and stronger they are.
The Moderate Resolution Imaging Spectroradiometer or MODIS instrument aboard NASA's Aqua satellite gathered water vapor content and temperature information on Paulette on Sept. 15 at 3:25 a.m. EDT (0725 UTC). The MODIS data showed highest concentrations of water vapor and coldest cloud top temperatures were north of the center of circulation. That area had coldest cloud top temperatures that were as cold as or colder than minus 70 degrees Fahrenheit (minus 56.6 degrees Celsius) in those storms. Storms with cloud top temperatures that cold have the capability to produce heavy rainfall.
The Advanced Microwave Scanning Radiometer 2 (AMSR2) onboard the GCOM-W1 satellite is a remote sensing instrument for measuring weak microwave emission from the surface and the atmosphere of the Earth. U.S. Navy Hurricane Specialist Dave Roberts at NOAA's National Hurricane Center in Miami, Fla. noted, "At 1:53 a.m. EDT (0533 UTC) the AMSR2 overpass on Paulette already reveals structural changes associated with the approaching mid-latitude baroclinic zone. The microwave image and GOES-16 satellite's mid- to upper-level water vapor imagery show drier more stable air beginning to intrude into the western portion of the cyclone. Additionally, Paulette's rain shield is more confined to the northern half of the system, while drying out in the southern semi-circle. Only fragments of the eyewall remain in that particular area."
Paulette's status on Sept. 15
At 11 a.m. EDT (1500 UTC), the center of Hurricane Paulette was located near latitude 38.3 degrees north and longitude 57.9 degrees west. That is about 570 miles (915 km) northeast of Bermuda. Paulette is moving toward the northeast near 29 mph (46 kph). Maximum sustained winds are near 105 mph (165 kph) with higher gusts. The estimated minimum central pressure is 965 millibars.
Paulette's forecast
The NHC said, "Some strengthening is possible through tonight, but rapid weakening is forecast to begin on Wednesday as the cyclone undergoes extratropical transition. Paulette should complete its transition to an extratropical cyclone on Thursday. A faster motion toward the east-northeast is expected through Thursday. Afterward, Paulette is forecast to slow down and turn toward the east-southeast and south-southeast late Thursday and Friday."
Provided by NASA's Goddard Space Flight Center


