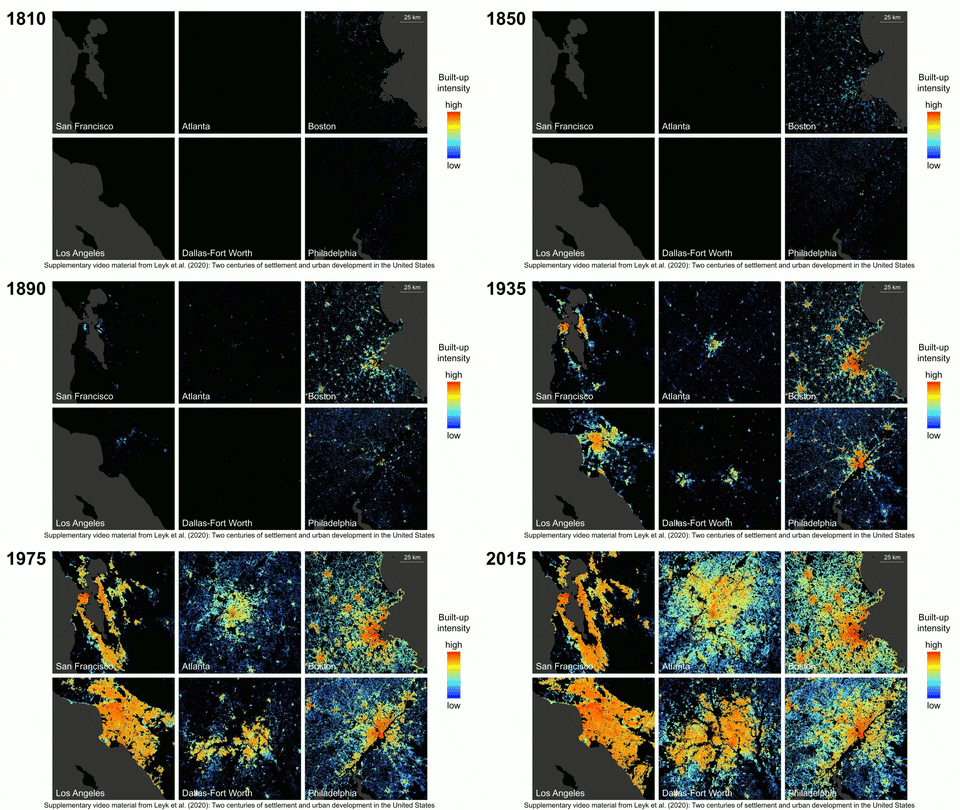
Credit: Science Advances
Over the past 200 years, the population of the United States has grown more than 40-fold to an estimated 328 million, with 81% of the population living in an urban area. Cities, as we know them, are constantly changing and up until now, the absence of long-term data has limited our understanding of how our cities have become what they are today.
New research co-authored by Dylan Connor, assistant professor in the School of Geographical Sciences and Urban Planning, provides the most extensive picture to date of how urban development has unfolded in the U.S. over the past two centuries.
In his paper, published in Science Advances, Connor and his colleagues, led by Stefan Leyk of the University of Colorado Boulder, analyzed hundreds of millions of U.S. property records on buildings constructed between 1810 and 2015, enabling researchers opportunities to study land use, population change and urbanization at a granular level like never before.
The dataset, obtained through a collaboration with online real estate company Zillow, details the year each building was constructed, its location and what materials it is made of, among other things. Using mapping and basic statistics, Connor and his colleagues analyzed the data and identified developmental patterns to serve as a beacon of what can be done with the data compared to what was previously possible.
"This data gives you an opportunity to understand urban development in a new way and from that, to plan smarter," Connor said. "Cities have always been changing and we now have a lot more information to understand those changes than we had before."
Empowering local policy and developmental efforts
Understanding where, why and how urbanization has changed over time is essential to addressing a host of challenges ranging from predicting the impact natural disasters can have on community resilience, to forecasting urban sprawl, gentrification and redevelopment.
Connor and his colleagues are conducting additional research using buildings' structural data to identify areas along the U.S. coastlines that are most vulnerable to sea-level rise and impending natural disasters.
Similar urban vulnerability research can be applied to heat exposure and heat adaptation in Phoenix, which Connor says will likely be an area to explore in the future.
"In terms of local planning, if you were trying to pinpoint places that are vulnerable to coastal hazards, or heat exposure, or potential gentrification, these data could help you pinpoint the area of your city or the part of your community or neighborhood that's most at risk to change. It empowers local policy and development efforts to plan smarter for the future."
The future of equitable cities
Connor, whose research at ASU focuses on leveraging historical data sources to better understand intersections between inequality and basic needs, says he hopes the work he and his colleagues are doing enables researchers to undertake future social equity studies.
"I hope people use these data to make cities more equitable," Connor said. "It's becoming increasingly clear that the way cities are designed has huge impacts on people's life chances and how people will fare in the face of future climate change."
"There is a huge amount of scope to use these data in smart ways to try and figure out how we can design more equitable cities, more inclusive cities."
Connor suggests that as the field of geography progresses, this type of mass data analysis will be even more prevalent in the future.
"I think this is where a lot of the field is going, which is intelligently crunching these huge data sources to try and understand how the world is changing around us and what impact that is having on our lives."
More information: Stefan Leyk et al. Two centuries of settlement and urban development in the United States, Science Advances (2020). DOI: 10.1126/sciadv.aba2937
Journal information: Science Advances
Provided by Arizona State University


