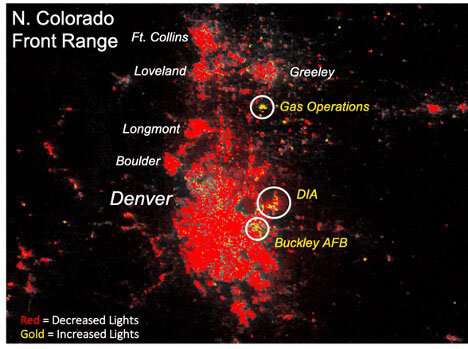
Light changes over Colorado. Red denotes decreased light, gold denotes increased light. Credit: Colorado State University
As the coronavirus pandemic continues into its fourth month in the United States, Americans have adapted to radically different circumstances. While many now work from home, others are looking for new jobs. Travel has slowed to a trickle, and social gatherings, from weddings to graduations, have been canceled.
The impact of these changes is noticeable even from space. At the Cooperative Institute for Research in the Atmosphere (CIRA) at Colorado State University, scientists who study the Earth using satellites are seeing drastic decreases in atmospheric pollutants, such as nitrogen dioxide and sulfur dioxide, around the world. Air quality has been markedly improved, as emissions from vehicles and industry are curbed.
But it's not just cleaner air that marks these societal shifts. Using a sensor that detects low levels of visible light at night, scientists can even map changes in where people live and where they go.
A sensor that sees lights
The Day/Night Band (DNB) sensor that flies on two NOAA satellites has been instrumental in discovering many new features of our planet. The DNB also sees city lights – brilliant markers of human civilization that light up the night skies. Onboard a satellite that orbits the earth every 90 minutes, the DNB can detect changes in these lights between each new overpass – before and after hurricanes, for example, seeing locations where storms have knocked out electrical infrastructure.
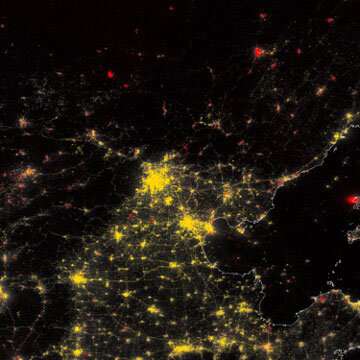
Beijing light comparison. Red lights denote areas where lights are off as a result of the pandemic, with gold denoting new/increased amounts of light. Credit: Colorado State University
Scientists have built up a database of light sources for the entire planet, and by comparing these long-term averages against what can be seen now, they can detect changes in how people are responding to the pandemic crisis. Steven Miller, a senior scientist and deputy director of CIRA, along with partners at the Colorado School of Mines and the University of Wisconsin, has processed several comparison images that were featured by NOAA.
"The Day/Night Band has opened our eyes to the nocturnal environment in ways that no other sensor up in space can," said Miller, who, with colleagues, works to provide agencies with comparison imagery using DNB data. "But the one thing that really sets it apart from other kinds of satellite data is its ability to capture the human dimension – it offers the epiphany of our own existence and coexistence as part of the Earth's biosphere."
Where the lights are on, and off
One of the first things that can be seen from these before-and-after comparisons is where people aren't – lights that are turned off in factories, municipal gathering areas, and major travel and commerce corridors, for example. Seeing where the lights are off reveals the direct social and economic impacts of closures and quarantining. On the other hand, over Beijing, notable and uniform light increases from February through March indicate a return to normalcy in the region; the uniformity of the light increase demonstrates the strong central influence of the Chinese government in driving social and economic policy in even remote areas.
Using data collected by Chris Elvidge at the Colorado School of Mines, we can look closer at Colorado, where it's possible to compare the difference between lights at Denver International Airport and Buckley Air Force Base, just a few miles to the south. As air traffic to the Denver airport fell off with curtailed civilian travel, DNB imagery shows a marked decrease on the north side of the airport, where the passenger terminals are located. On the south end, however, an increase in light suggests an uptick in cargo flights, perhaps linked to the increase in online shopping as in-store purchases have plummeted. The increased lights from Buckley AFB reveal how the critical national security work at Buckley continues to "shine on," unabated.
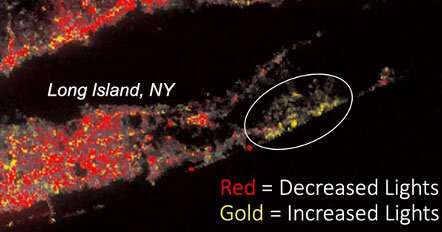
Light changes over Long Island, NY. Credit: Colorado State University
Other shifts in human behavior are noted by where the lights are now brighter than before. Over New York City, the lights of apartments in Manhattan are dimmed, while in the exurbs of Long Island, summer houses and second homes belonging to the wealthiest residents of New York City are now blazing with light. For those with resources, the coronavirus pandemic marks a shift in their physical location – one large enough to be seen from space.
Eager for new satellite applications
As the impacts of the COVID-19 pandemic continue to play out, scientists at CSU and CIRA are eager to find new applications for the satellite data. The utility of these measurements could prove valuable to sociologists and public health services, providing data that directly map how people respond to situations that limit and alter their patterns of movement. Correlations between economic output and the measurable changes of light emitted could be valuable to economic researchers and government agencies. As many areas of the country prepare to reopen, while other regions hunker down for spikes in cases, seeing the differences from space could provide additional insight both now and for the future.
"It will be interesting to see, in retrospect, how 2020 plays out in the U.S.– will it be marked by a single March/April anomaly, or will it be a year bookended by dramatic changes to our lights, and to our lives?, " Miller commented. "There is a story, or perhaps riddle, behind each change that we see – tied to human behaviors, economic drivers, and vulnerabilities. What we learn from this latest bout with COVID-19 can help to inform planners on what to expect if there is a next time, and perhaps from a societal response perspective, lessons on how to duck and dodge at least some of its punches."
Regardless of changes, scientists at CSU be constantly monitoring, looking at the Earth from space, and ready to assist with new data from unexpected sources.
Provided by Colorado State University


