A tool to understand how ecosystems are responding to a changing climate

As climate change accelerates, recording shifts in plant flowering times is critical to understanding how changes in climate will impact ecosystem interactions. Currently, when researchers reconstruct historical flowering times using dried herbarium specimens, they estimate first or peak flowering time using the day of the year (DOY) of plant collection as a proxy. Because herbarium specimens are collected at many different stages of flowering and fruiting (called "phenological" stages), this practice of using the day of collection creates shaky data that limits our ability to estimate how ecosystems will respond to a shifting climate.
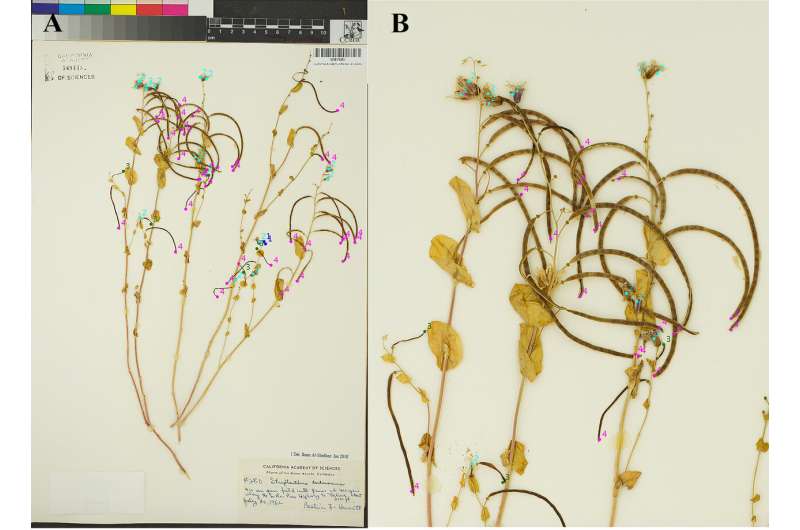
In research presented in a recent issue of Applications in Plant Sciences, Natalie Love, M.S., and colleagues developed a new quantitative measure of phenological status, called the "phenological index," to improve scoring of developmental stage in herbarium specimens. In their paper, the team presents a protocol for deriving the phenological index of herbarium specimens in an automated way, using the free software package ImageJ.
"Herbarium specimens can be collected at a wide range of phenological stages from all buds to all fruits, so the assumption that specimens are collected on their day of year of first flower or peak flower is inaccurate," said Love, corresponding author on the manuscript and Ph.D. student at the University of California Santa Barbara. "This could be especially problematic if models constructed with these datasets are used to predict the day of year of onset of a particular assumed phenophase, which is one of the ultimate goals of studying phenology."
"Our method allows researchers to be able to predict the day of year of onset of a specific phenophase (like peak flowering), rather than assuming that DOY is equivalent to peak flowering or the day of first flower," said Love. Her team tested their new approach in Streptanthus tortuosus, a small plant in the mustard family that is native to the mountains of California. They found that plugging in the phenological index measures into climate models changed their outcomes. "Using our model would actually predict a higher degree of phenological advancement in response to climate change," said Love.
The phenological index and associated protocols are being rolled out at the same time as a digitization project targeting millions of California herbarium specimens, called Capturing California's Flowers. "In advance of the completion of this massive effort, we wanted to provide the phenological research community with new and improved methods with which to analyze the millions of additional imaged specimens that will soon be available to researchers," said Love.
The tools they present here will help make sense of this treasure trove of data, and give phenological researchers well beyond California the metrics needed to predict ecological responses to a changing world.
More information: Natalie L. Rossington Love et al, A new phenological metric for use in pheno‐climatic models: A case study using herbarium specimens of Streptanthus tortuosus, Applications in Plant Sciences (2019). DOI: 10.1002/aps3.11276
Journal information: Applications in Plant Sciences
Provided by Botanical Society of America


