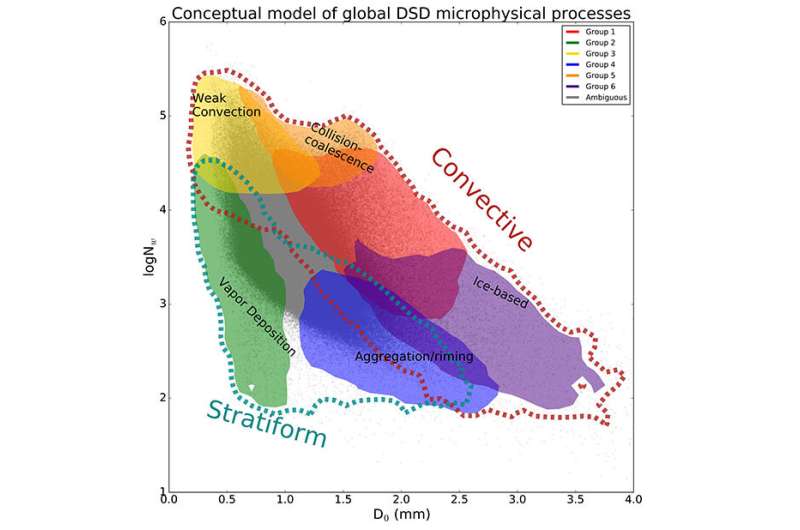
Researchers determined the dominant mechanisms for six groups from surface disdrometers using principal component analysis as a function of median drop diameter (D0), measured in millimeters (mm), and normalized intercept parameter (Nw). The grey dots represent every point in the global data set. Solid contours represent smoothed Gaussian 1- regions encompassing each of the groups; inferred processes are in dark grey. Credit: US Department of Energy
If you want to predict extreme rainstorms, it's vital you know how small processes, such as condensation, affect bigger systems. These small processes, however, are hard to study. To learn more about these microphysical processes, researchers performed statistical analysis on a global data set of rain drop size distributions. They revealed the rain drops fit into six groups. These groups are independent of location. That is, the drop size distributions revealed six main groups that are linked to cloud processes and types.
The results offer two key benefits. First, they improve our physical understanding of how small, microphysical processes impact rainfall. Second, they provide new information regarding the global variability of rain cloud type (warm rain, ice-based precipitation, etc.). Scientists can use the results in two key ways. They can fine-tune models to better represent precipitation processes. Also, they can improve remote-sensing retrievals of rainfall.
The team analyzed twelve disdrometer data sets (including four from the Department of Energy's Atmospheric Radiation Measurement user facility). Disdrometers are surface instruments that measure the size of rain drops. The team gathered the data across three latitude bands, spanning a broad range of precipitation regimes: light rain, orographic, deep convective, organized mid-latitude, and tropical oceanic. The team used principal component analysis to reveal comprehensive modes of global drop size distribution spatial and temporal variability. Although the locations contain different distributions of individual drop size distribution parameters, all locations have the same modes of variability.
Based on the principal component analysis, six groups of points with unique drop size distribution characteristics emerge. The physical processes that underpin these groups are revealed through supporting radar observations. These groups are consistent with different types of convection: weak, ice-dominated, and robust warm rain/collision-coalescence; and stratiform processes governed by vapor deposition and aggregation. The low latitudes have more frequent robust warm rain/collision-coalescence, while the mid-latitudes have a larger component of ice-based convection. Although all locations exhibit the same co-variance of parameters associated with these groups, it is likely that the physical processes responsible for shaping the drop size distributions vary as a function of location. This is a subject of future study, as is linking the modes of variability to environmental parameters.
More information: B. Dolan et al. Primary Modes of Global Drop Size Distributions, Journal of the Atmospheric Sciences (2018). DOI: 10.1175/JAS-D-17-0242.1
Provided by US Department of Energy


