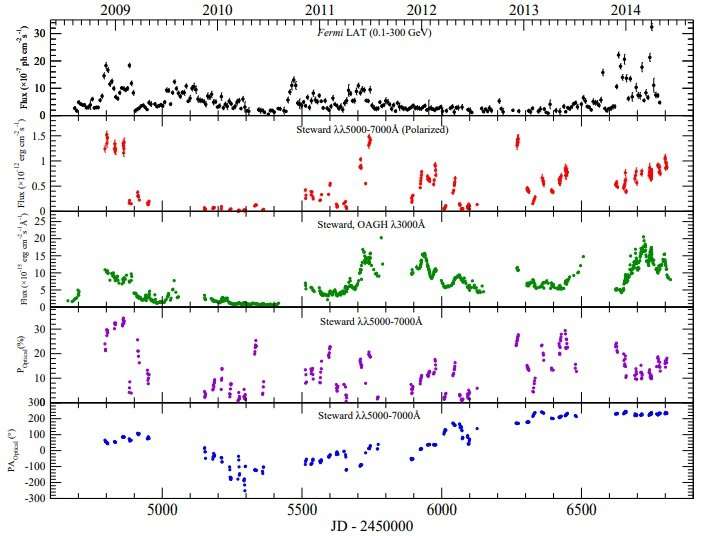
The behavior of the polarimetric observations (P, PA, Polarized Flux) compared with the gamma-rays and the UV-continuum for 3C 279. Credit: Patiño-Álvarez et al., 2018.
An international team of astronomers has conducted multi-wavelength photometric and spectropolarimetric observations of the quasar 3C 279, which revealed three different activity periods in this object. The finding is reported in a paper published June 5 on the arXiv pre-print repository.
Located in the constellation Virgo, 3C 279 is an optically violent variable quasar (quasi-stellar radio source), known for its variations in the visible, radio, and X-ray bands. Recent studies suggest that 3C 279 should be classified as a blazar—a very compact quasar associated with a supermassive black hole at the center of an active, giant elliptical galaxy. Blazars are perceived by astronomers as high-energy engines serving as natural laboratories to study particle acceleration, relativistic plasma processes, magnetic field dynamics and black hole physics.
Although many observations of 3C 279 have been conducted in different wavelengths, there are still uncertainties regarding the location of the gamma-ray production zone in this source. In order to clarify these concerns, a group of astronomers led by Víctor Manuel Patiño-Álvarez of the Max Planck Institute for Radio Astronomy in Bonn, Germany, has analyzed the light curves for 3C 279 from 1 millimeter to gamma-rays, obtained over a time span of six years.
"In this paper, we present light curves for 3C 279 over a time period of six years; from 2008 to 2014. Our multi-wavelength data comprise 1 mm to gamma-rays, with additional optical polarimetry," the researchers wrote in the paper.
In particular, the astronomers performed an analysis of data from a real variety of bands, including optical and near-infrared photometry, optical spectra, millimeter, gamma-rays, X-rays, and spectropolarimetry. These data were acquired by many ground-based observatories and space telescopes.
The observations based on the behavior of the gamma-ray light curve with respect to other bands led to the identification of three different activity periods in 3C 279, namely period A, B and C.
According to the paper, during period A multiple flares in the gamma-ray emission, as well as counterparts in the optical (V-band), ultraviolet continuum, and near-infrared emission (J-, H- and K-bands) were observed. During period B, multiple flares in the optical V-band, with clear counterparts in the ultraviolet spectral continuum and near-infrared bands, were identified.
When it comes to period C, the researchers observed the highest levels of gamma-ray emission in their time-frame of the study.
"At the start of this time period we observe a very intense flare in the gamma-rays with a clear counterpart in the 1 mm emission, and high levels of degree of polarization, however, we do not see any response in the wavelength range from ultraviolet to near-infrared," the paper reads.
According to the researchers, the results suggest that the dominant emission mechanism for the gamma-rays in 3C 279 changes with time. However, they added that there is also a possibility that the location of the gamma-ray emission zone itself changes depending on the activity state of the central engine.
More information: Multiwavelength Photometric and Spectropolarimetric Analysis of the FSRQ 3C 279, arXiv:1806.01693 [astro-ph.HE] arxiv.org/abs/1806.01693
Abstract
In this paper, we present light curves for 3C 279 over a time period of six years; from 2008 to 2014. Our multiwavelength data comprise 1 mm to gamma-rays, with additional optical polarimetry. Based on the behaviour of the gamma-ray light curve with respect to other bands, we identified three different activity periods. One of the activity periods shows anomalous behaviour with no gamma-ray counterpart associated with optical and NIR flares. Another anomalous activity period shows a flare in gamma-rays, 1 mm and polarization degree, however, it does not have counterparts in the UV continuum, optical and NIR bands. We find a significant overall correlation of the UV continuum emission, the optical and NIR bands. This correlation suggests that the NIR to UV continuum is co-spatial. We also find a correlation between the UV continuum and the 1 mm data, which implies that the dominant process in producing the UV continuum is synchrotron emission. The gamma-ray spectral index shows statistically significant variability and an anti-correlation with the gamma-ray luminosity. We demonstrate that the dominant gamma-ray emission mechanism in 3C 279 changes over time. Alternatively, the location of the gamma-ray emission zone itself may change depending on the activity state of the central engine.
© 2018 Phys.org


