Putting molten history on the map

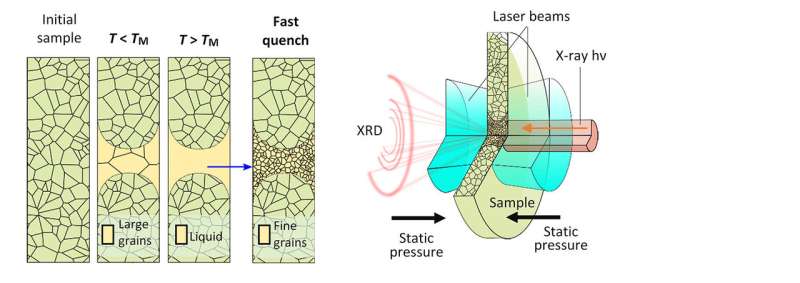
At temperatures as hot as the sun and under pressures over a million times atmospheric pressure, the metal molybdenum melts. Tracking the molten history of the metal clarified the melting point, the border between solid and liquid phases. To track the melting process, a team focused an x-ray beam into the tight confines between two ultra-hard diamond micro-anvils. A laser heated the small volume. The x-ray beam allowed the tracking of fine features that uniquely formed from the melted metal and were a clear indication that melting had occurred.
Characterization of high-pressure melting was used to map the important region of the temperatures and pressures just before a solid metal melts to become a pool of liquid. Measurements at extreme temperatures and pressures were made possible using a miniature diamond cell and a laser. This new x-ray scattering method enabled a more accurate phase map. It resolved differences between models and earlier experiments, and also revealed a new phase.
The reliable detection of the melting point of materials at high pressure has been experimentally difficult. What is needed is a way to tell whether a sample is solid or liquid in the confines of a small high-pressure cell. With this new method, controlled laser heating and rapid cooling created a measurable structural signature that labelled a material's trip into the molten state.
In the research, a team sandwiched a small sample of molybdenum metal between miniature diamond anvils. They squeezed the metal to extreme pressures: over a million times the Earth's atmospheric pressure. They used infrared laser beams to heat the sample volume to extreme temperatures up to that on the surface of the sun. At the same time, a bright highly focused x-ray beam generated diffraction patterns. These patterns are sensitive to the micro-crystalline state of the metal. Researchers found that the distribution of the initial crystalline grain sizes grew to larger diameters after initial heating.
When the sample melted, the grains disappeared. And, after rapid cooling, the liquid re-crystallized with much smaller grains. These assessments can be used to answer the question, even after the fact, of whether a particular temperature excursion caused the metal to melt. The structural changes are a new, more reliable criterion for exploring the phase map at extreme pressure and temperature. This new approach improved the accuracy of the molybdenum phase map and removed discrepancies between theory and less accurate measurements in the scientific literature.
Also, the study of the microstructure close to but below the melting point revealed a new phase with highly textured re-arrangement of fine grains. It is similar to the textured structure found after deposition of metal films onto a substrate by vapor condensation. Learning to manipulate these microstructures has implications for a host of high-temperature applications, including mechanical properties of materials in engines and armaments.
More information: Rostislav Hrubiak et al. Microstructures define melting of molybdenum at high pressures, Nature Communications (2017). DOI: 10.1038/ncomms14562
Journal information: Nature Communications
Provided by US Department of Energy


