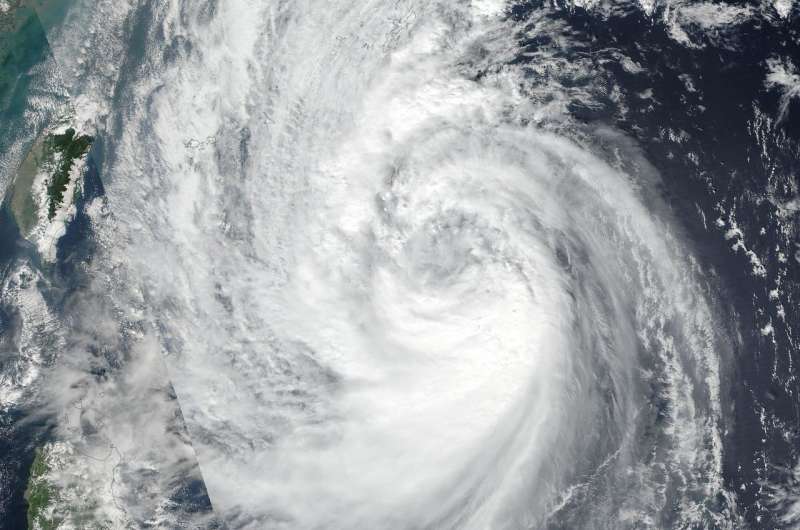
On Oct. 27 at 12 a.m. EDT (04:00 UTC) NASA-NOAA's Suomi NPP satellite captured this visible image of Tropical Storm Saola in the Philippine Sea. Credit: NOAA/NASA Goddard Rapid Response Team
Wind shear continued affecting Tropical Storm Saola and the Global Precipitation Measurement mission or GPM core satellite saw strong storms west of the center of circulation. In addition, NASA-NOAA's Suomi NPP satellite also provided a visible image of the storm that showed the bulk of clouds were still being pushed south of center.
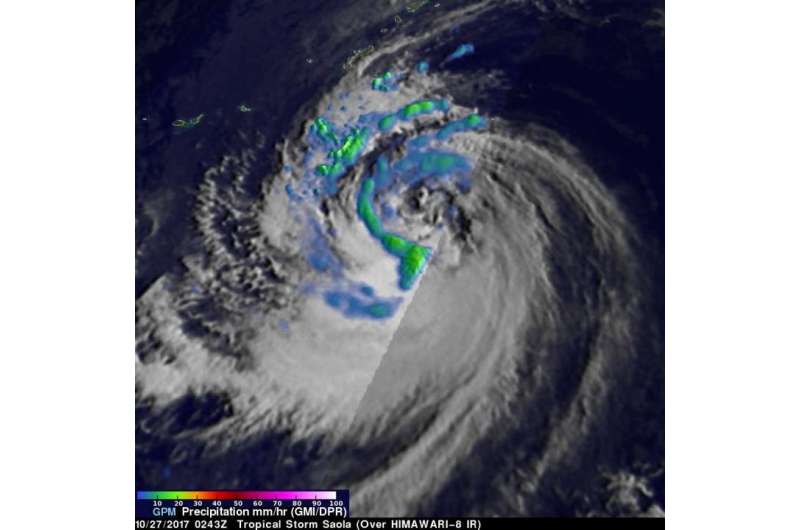
The GPM core observatory had a fairly good view of Tropical Storm Saola on Oct. 27 at 0243 UTC (Oct. 26 at 10:43 p.m. EDT). GPM's Microwave Imager (GMI) and Dual-Frequency Precipitation Radar (DPR) instruments received data showing the intensity of rainfall over the western half of Tropical Storm Saola. GPM's radar (DPR Ku Band) discovered that rain was falling at a rate of over 66 mm (2.6 inches) per hour in feeder bands wrapping around that side of the tropical storm. The most intense convective storms appeared to be located in the southern part the system where the GPM pass didn't provide complete coverage.
A 3-D animation, created at NASA's Goddard Space Flight Center in Greenbelt, Maryland revealed the relative heights of precipitation within tropical storm Saola. The animation was produced by blending measurements from GPM's radar (DPR Ku band) with cloud top heights that were based on the HIMAWARI-8 satellite's infrared image temperatures. Storm tops within feeder bands on Saola's western side were found by GPM's radar to reach heights of above 13.5 km (8.4 mile). The structure of clouds within tropical storm Saola's partially exposed center of circulation were evident in the close-up virtual flyby. GPM is a joint mission between NASA and the Japanese space agency JAXA.
On Oct. 27 at 0243 UTC (Oct. 26 at 10:43 p.m. EDT GPM found rain falling at a rate of over 66 mm (2.6 inches) per hour in feeder bands wrapping around the western side of the tropical storm where cloud tops reached heights of above 13.5 km (8.4 mile). Credit: NASA/JAXA, Hal Pierce
On Oct. 27 at 12 a.m. EDT (04:00 UTC) NASA-NOAA's Suomi NPP satellite captured a visible image of Tropical Storm Saola as it continued tracking through the Philippine Sea. The image showed the bulk of clouds were still being pushed south of center from vertical wind shear.
From 4 a.m. EDT (0800 UTC) on, animated infrared satellite imagery revealed significant structural improvement with a band of convection nearly encircling the broad low level circulation center.
By 11 a.m. EDT (1500 UTC) Saola's maximum sustained winds were near 55 knots (63.2 mph/102 kph). It was centered near 24.2 degrees north latitude and 128.1 degrees east longitude, about 169 nautical miles south of Kadena Air Base, Okinawa, Japan. Saola has tracked north-northwestward at 15 knots (17.2 mph/27.7 kph).
The Joint Typhoon Warning Center (JTWC) predicts that Saola will have peak intensity tomorrow and may briefly be a typhoon with winds of 65 knots (75 mph). Saola is expected transition into a cold-core low pressure area when it brushes the southern edge of the Japanese islands of Kyushu and Shikoku. JTWC Forecasters noted that by mid-day on Oct. 29 "a cold surge over the sea of japan will extend over the southern Japanese islands enhancing the distribution of gale force winds. The cool dry air entrainment into Saola will aid in the rapid deterioration of the system as it gets embedded into the mid-latitude westerlies and completes extra-tropical transitioning south of Honshu."
Provided by NASA's Goddard Space Flight Center


