Why hot weather records continue to tumble worldwide

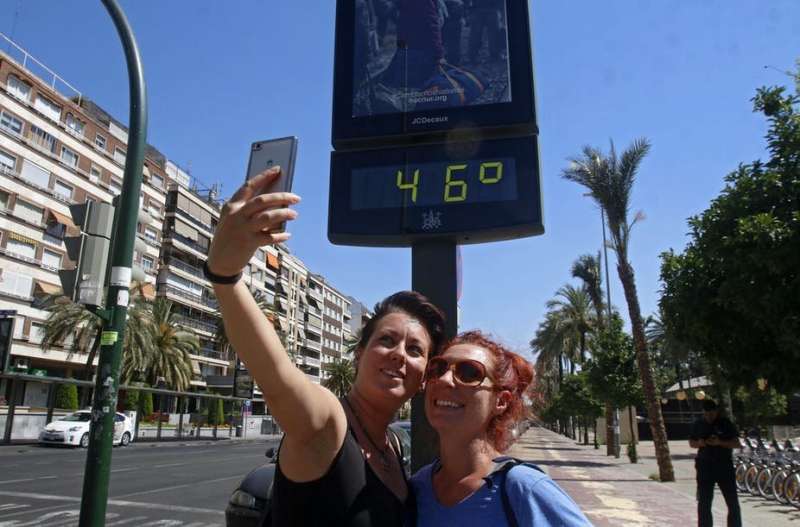
It sometimes feels like we get a lot of "record-breaking" weather. Whether it's a heatwave in Europe or the "Angry Summer" in Australia, the past few years have seen temperature records tumble.
This is the case both locally – Sydney had its hottest year on record in 2016 – and globally, with the world's hottest year in 2016 beating the record set only the year before.
Some of 2016's heat was due to the strong El Niño. But much of it can be linked to climate change too.
We're seeing more heat records and fewer cold records. In Australia there have been 12 times as many hot records as cold ones in the first 15 years of this century.
If we were living in a world without climate change, we would expect temperature records to be broken less often as the observational record grows longer. After all, if you only have five previous observations for annual temperatures then a record year isn't too surprising, but after 100 years a new record is more notable.
In contrast, what we are seeing in the real world is more hot temperature records over time, rather than less. So if you think we're seeing more record-breaking weather than we should, you're right.
Why it's happening
In my new open-access study published in the journal Earth's Future, I outline a method for evaluating changes in the rate at which temperature records are being broken. I also use it to quantify the role of the human influence in this change.

To do it, I used climate models that represent the past and current climate with both human influences (greenhouse gas and aerosol emissions) and natural influences (solar and volcanic effects). I then compared these with models containing natural influences only.
Lots of hot records, fewer cold ones
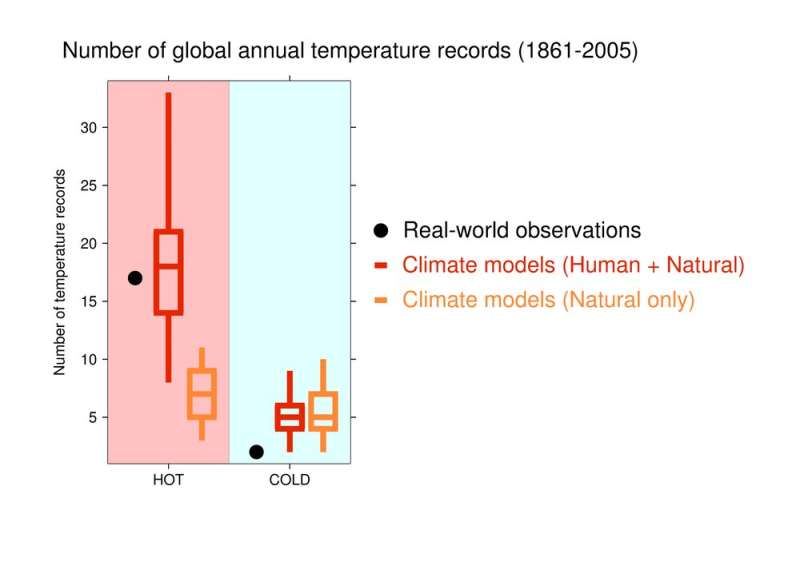
Taking the example of global annual temperature records, we see far more record hot years in the models that include the human influences on the climate than in the ones without.
Crucially, only the models that include human influences can recreate the pattern of hot temperature records that were observed in reality over the past century or so.
In contrast, when we look at cold records we don't see the same difference. This is mainly because cold records were more likely to be broken early in the temperature series when there were fewer previous data. The earliest weather data comes from the late 19th century, when there was only a weak human effect on the climate relative to today. This means that there is less difference between my two groups of models.
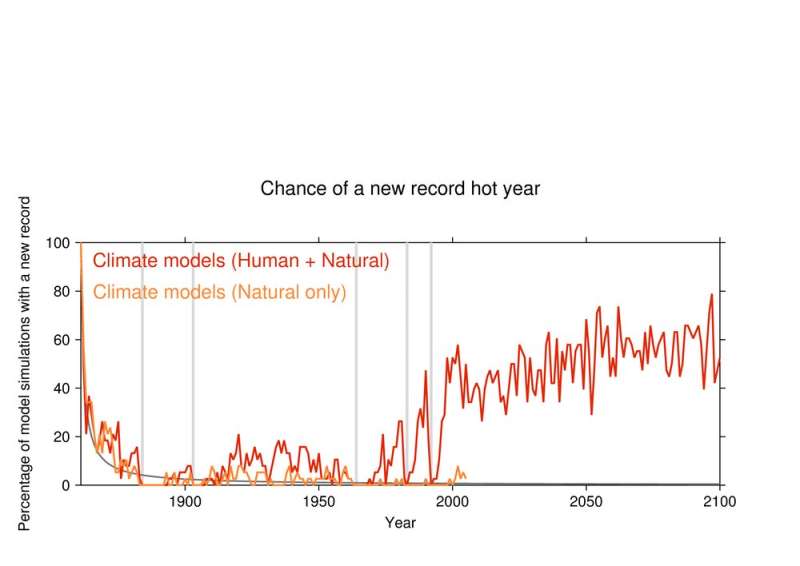
In the models that include human influences on the climate, we see an increase in the number of global record hot years from the late 20th century onwards, whereas this increase isn't seen in the model simulations without human influences. Major volcanic eruptions reduce the likelihood of record hot years globally in both groups of model simulations.
Projecting forward to 2100 under continued high greenhouse gas emissions, we see the chance of new global records continuing to rise, so that one in every two years, on average, would be a record-breaker.

I also looked at specific events and how much climate change has increased the likelihood of a record being broken.
I used the examples of the record hot years of 2016 globally and 2014 in Central England. Both records were preceded by well over a century of temperature observations, so in a non-changing climate we would expect the chance of a record-breaking year to be less than 1%.
Instead, I found that the chance of setting a new record was increased by at least a factor of 30 relative to a stationary climate, for each of these records. This increased likelihood of record-breaking can be attributed to the human influence on the climate.
More records to come?
The fact that we're setting so many new hot records, despite our lengthening observation record, is an indicator of climate change and it should be a concern to all of us.
The increased rate at which we are getting record hot temperatures is controlled by the speed of global warming, among other factors. To meet the Paris target of keeping global warming below 2℃ we will have to reduce our greenhouse gas emissions drastically. Besides keeping average global temperatures under control, this would also reduce the chance of temperature records continuing to tumble, both globally and locally.
Provided by The Conversation
This article was originally published on The Conversation. Read the original article.![]()


