Digital tools for maintaining forest diversity

In order to maintain forests' diversity while their resources are put to maximum use, forest owners and planners need to make informed decisions and weigh all possible options. Luke's digital planning tools make this task a whole lot easier.
It's a tough job but someone has to do it. In the years and decades to come, Finnish forest planners and owners face new challenges as the National Forest Strategy 2050 and the Finnish Bioeconomy Strategy aim to, among others, increase logging by over ten million cubic meters in the next ten years.
How to maintain the integrity and diversity of Finnish forests while getting as much out of them as possible? One source of help is digitalisation. Digital tools bring additional value into handling large amounts of information and customizing them according to the case at hand, says Tuula Packalen, professor and forest planning researcher at Luke.
"If you need to produce information that covers not just individual forest areas but whole municipalities and even countries, the sheer amount of data is impossible to manage without digital aid."
Luke has been working on digital tools for forest-related tasks and processes for a while now, Packalen says. Now Luke's researchers develop several digital tools that help plan forest use and provide valuable information on forest resources and ecosystems to base important decisions on. Two prime examples are the forest indicator and the aptly named Yoda.
Yoda helps to make balanced decisions
Your Own Decision Aid or Yoda in short, is Luke's web-based tool for evaluating different planning projects one at a time. It's a versatile and participatory tool, says one of Yoda's developers, researcher Mikko Kurttila.
"Yoda has a visual user interface and is suitable for various different uses. That means people from different fields of work, not only forestry, can use it."
Luke's experts gather and put together data in Yoda for a certain use, for example evaluating which peatlands in a certain area should be restored, explains Anne Tolvanen, Luke's professor and researcher of ecology and multiple use of forests.
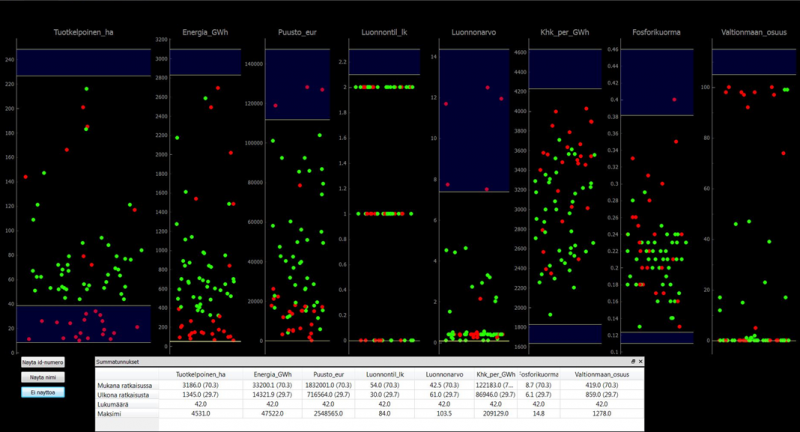
A peat producer, for example, might use Yoda in assessing which peatlands would benefit them the most. First they define the area they're interested in. Each peatland appears as a dot on a map. The user gets information on how much peat a certain peatland could generate, how much energy the peat contains or how diverse the peatland is.
"Yoda can be used in many different situations from forest planning to peatland assessment. Luke's experts can insert whatever data they have into this tool and it will help the user move forward with their plans," Tolvanen says.
In addition to providing exact and relevant forest resource data Yoda is also a tool for visualisation. Using different colours and symbols, it helps the user perceive the big picture quickly. Without visual aids the amount of information might not be as easy to grasp.
In 2017, Yoda is in development under the EU funded LIFEPeatLandUse project led by Anne Tolvanen. In the future, however, for example Luke's clients can use it according to their needs.
"Yoda will be a helpful tool for decision-makers from the grassroots level to executive seats in the European Union", Tolvanen says.
Forest indicator visualizes the big picture
Another significant digital tool for visualising the use of forests is called the Forest Indicator. Developed by Luke and several collaborators, such as universities, it's a web-based tool that takes into account how the use of forests affects not just trees, but also other ecosystem services Finnish forests have to offer including berries and mushrooms.
"The Forest Indicator opens its user's eyes to see the impact forest use can have on the diversity of our forests", Anne Tolvanen says.
The final version of the Forest Indicator will be the end result of a three-year research project that focuses on finding out how to get new products out of forests. Tolvanen acts as the lead researcher in it.
The Forest Indicator is meant for those interested in forest planning, individual forest owners, forest planners, officials and decision-makers. In 2017, the indicator is still in the making, but here's how it will work once it's finished.
The user enters the forest indicator web portal and selects a region they want to examine. The programme provides a list of indicators for the user to choose from based on Luke's forestry scenario models (MELA). It helps to answer questions like how to maximize the amount of berries the forest can yield or to maintain the area's diversity as well as possible.
"The indicator has several options and colors for visualizing data. The user can choose for example whether they want to see the indicators as a bar graph or a clock face, where the hand shows how far a forest's diversity is from the maximum," Tolvanen says.
Although small pieces in the large puzzle of forest planning, Yoda and the Forest Indicator can bring a big amount of support to forest planners', owners' and decision-makers' work. When it seems you can't see the forest for the trees, all you need to do is open your laptop and the help is there.
Provided by Natural Resources Institute Finland


