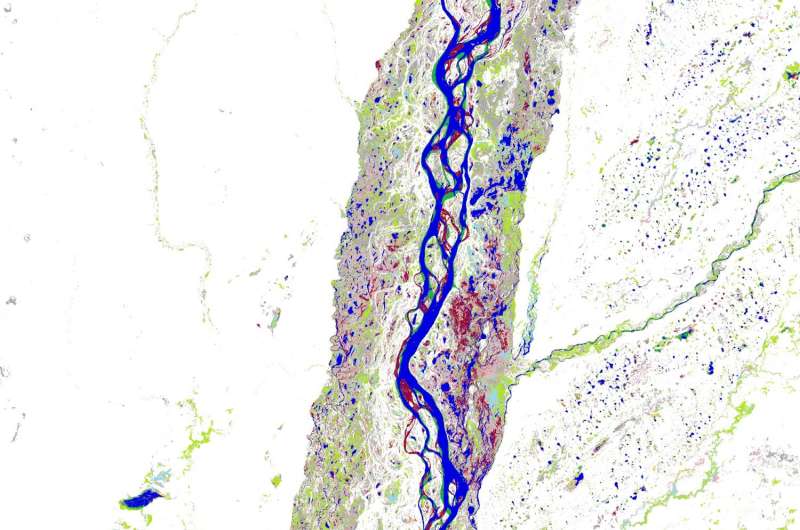
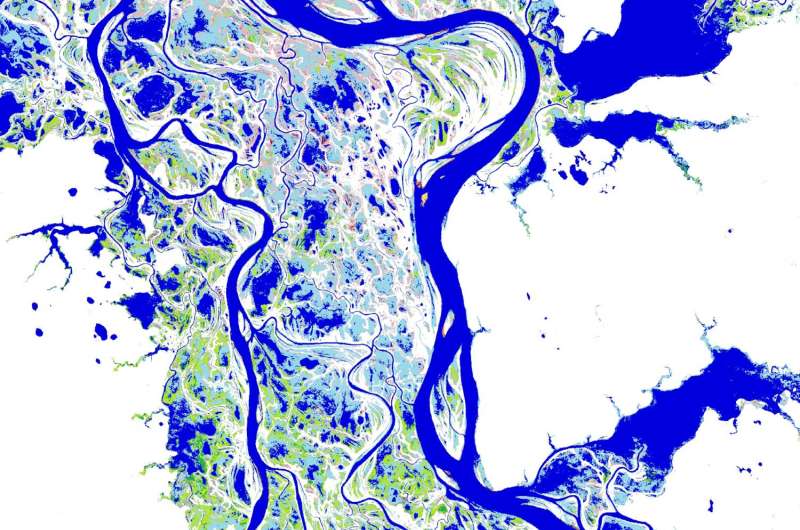
Map of the distribution and change in surface water over 32 years from over 3 million Landsat satellite images. The map shows the Paraná River in North-Eastern Argentina and shows how rivers meander and move, floodplains flood intermittently and new areas of permanent and seasonal water are being created and lost through time. Credit: European Commission - Joint Research Centre, 2016
(Phys.org)—A team of researchers with the European Commission's Joint Research Centre and Google Switzerland has combined historical data with modern mapping engines to produce high-resolution maps of the world's surface water (which excludes oceans). In their paper published in the journal Nature, the team describes how they created the new maps and offer some examples of clear changes to surface water over the past several decades.
In order to better manage water resources, scientists need to gain a historical perspective on the water systems that cover the planet—from huge lakes to tiny streams. But up till now, there were no available high-resolution maps that show not only where such water systems currently exist but how they have changed in the recent past. To rectify that situation, the researchers collected satellite image data taken every month during the years 1984 to 2015—3,066,102 images in all. They pulled that data into an expert computer system that was tied to the Google Earth Engine. After configuring the system, the team produced a series of high-resolution (to 30 meters) maps. Users of the system can begin with a general overview of an area and then zoom in to study the finer details of a given water system—all while noting changes that have occurred over the recent past.
The researchers report that they were able to see some startling changes, such as many water systems completely disappearing from areas in the Middle East. They were also able to pick out new water systems such as places where flooding had changed the course of a river or where dams had been built. The maps also revealed some of the changes that have already been wrought due to climate change—the expansion of lakes in the Tibetan Plateau, for example, that has come about due to increased snow melting on nearby mountains.
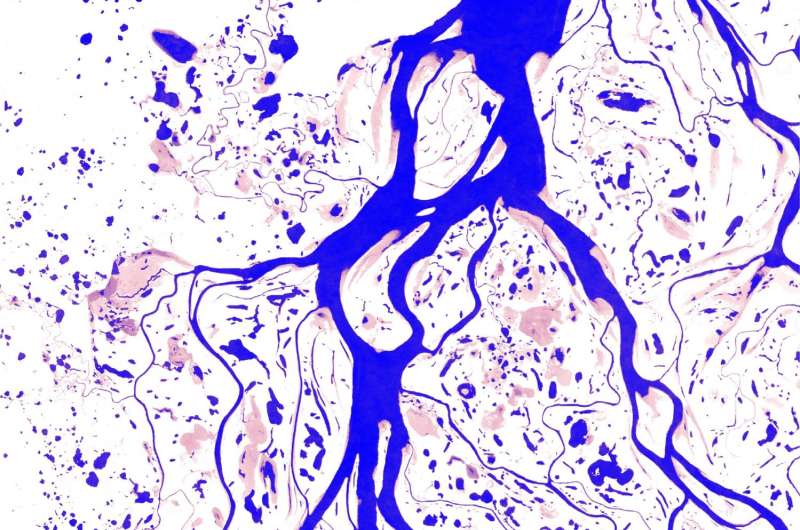
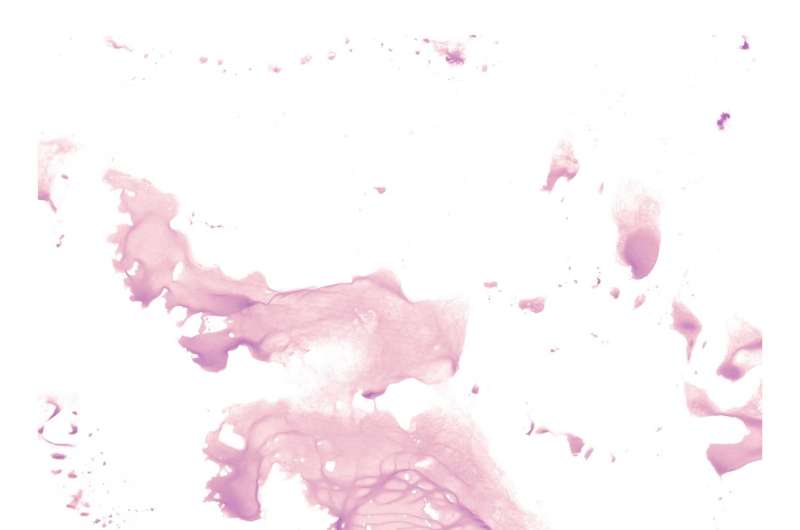
Map of the distribution and change in surface water over 32 years from over 3 million Landsat satellite images. This map shows the upper stretches of the Yenisei River (Река Енисей) in Russia and captures the spatial and temporal patterns in surface water. Dark blue colours are areas of permanent water and the pink colours show areas of where water occurs less often. Credit: European Commission - Joint Research Centre, 2016
The team reports that their mapping system also offers statistics such as the total amount of various types of water surface area across the globe, or parts of it, which can be used to identify trends such as decreasing water availability in areas where humans are pulling more water out of a system than nature can replace. It can also highlight potential trouble spots by noting, for example, certain details such as the fact that North America holds approximately 52 percent of all global surface water while hosting just five percent of the population.
-
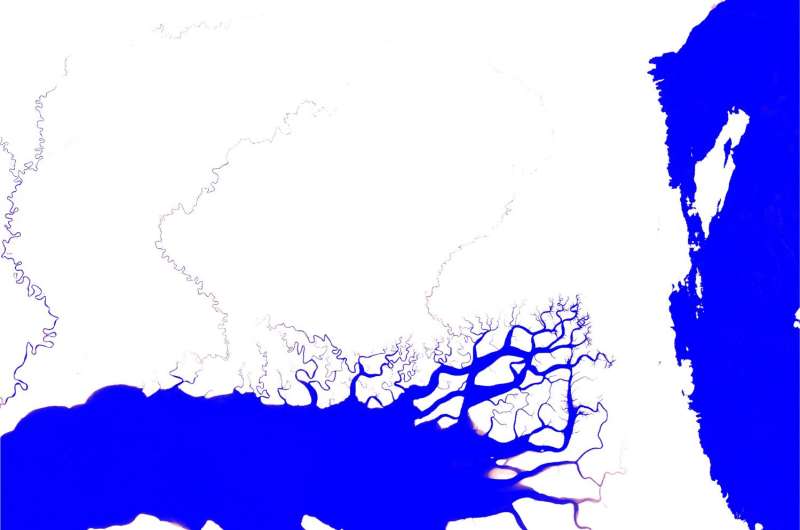
Map of the distribution and change in surface water over 32 years from over 3 million Landsat satellite images. This map shows an inlet in the south of the Bird’s Head Peninsula in West Papua, Indonesia and captures the spatial and temporal patterns in surface water. Dark blue colours are areas of permanent water and the pink colours show areas of where water occurs less often. Credit: European Commission - Joint Research Centre, 2016
-
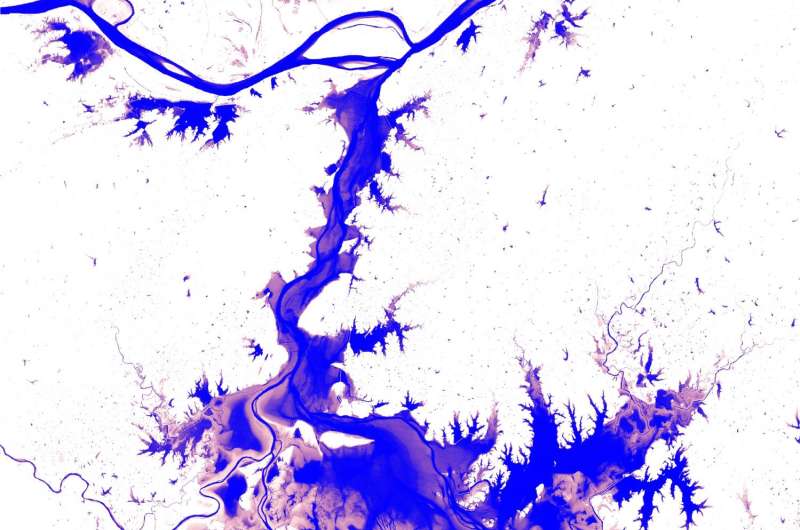
Map of the distribution and change in surface water over 32 years from over 3 million Landsat satellite images. This map shows Poyang Lake in Jiangxi Province, China and captures the spatial and temporal patterns in surface water. Dark blue colours are areas of permanent water and the pink colours show areas of where water occurs less often. Credit: European Commission - Joint Research Centre, 2016
-
Map of the distribution and change in surface water over 32 years from over 3 million Landsat satellite images. This map shows the River Ob (Река Обь) in western Siberia, Russia and captures the spatial and temporal patterns in surface water. Dark blue colours are areas of permanent water and the lighter blue colours are areas of seasonal water. Green colours represent new areas of seasonal water and pink colours represent areas of lost seasonal water. Credit: European Commission - Joint Research Centre, 2016
-
Map of the distribution and change in surface water over 32 years from over 3 million Landsat satellite images. This map shows Lake Gairdner National Park in Southern Australia and captures the spatial and temporal patterns in surface water. Credit: European Commission - Joint Research Centre, 2016
More information: Jean-François Pekel et al. High-resolution mapping of global surface water and its long-term changes, Nature (2016). DOI: 10.1038/nature20584
Abstract
The location and persistence of surface water (inland and coastal) is both affected by climate and human activity and affects climate, biological diversity4 and human wellbeing. Global data sets documenting surface water location and seasonality have been produced from inventories and national descriptions, statistical extrapolation of regional data and satellite imagery, but measuring long-term changes at high resolution remains a challenge. Here, using three million Landsat satellite images, we quantify changes in global surface water over the past 32 years at 30-metre resolution. We record the months and years when water was present, where occurrence changed and what form changes took in terms of seasonality and persistence. Between 1984 and 2015 permanent surface water has disappeared from an area of almost 90,000 square kilometres, roughly equivalent to that of Lake Superior, though new permanent bodies of surface water covering 184,000 square kilometres have formed elsewhere. All continental regions show a net increase in permanent water, except Oceania, which has a fractional (one per cent) net loss. Much of the increase is from reservoir filling, although climate change is also implicated. Loss is more geographically concentrated than gain. Over 70 per cent of global net permanent water loss occurred in the Middle East and Central Asia, linked to drought and human actions including river diversion or damming and unregulated withdrawal. Losses in Australia and the USA linked to long-term droughts are also evident. This globally consistent, validated data set shows that impacts of climate change and climate oscillations on surface water occurrence can be measured and that evidence can be gathered to show how surface water is altered by human activities. We anticipate that this freely available data will improve the modelling of surface forcing, provide evidence of state and change in wetland ecotones (the transition areas between biomes), and inform water-management decision-making.
Journal information: Nature
© 2016 Phys.org
