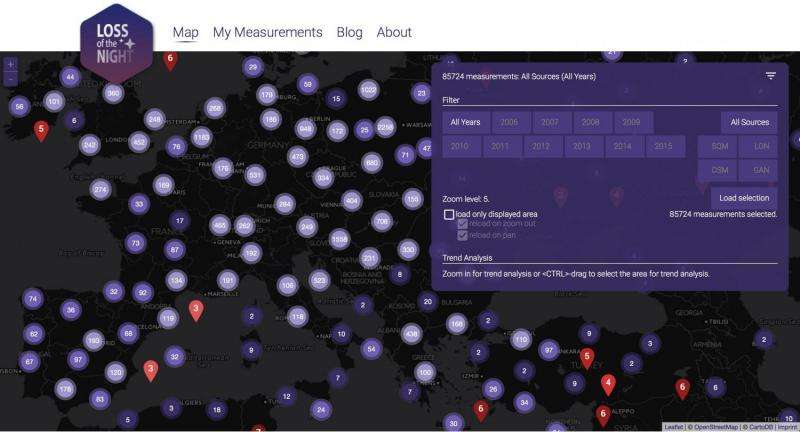
The screenshot shows skyglow data collected in Europe. The blue circles show how many observations were taken at that location. A red point indicates the sky brightness in terms of the Naked Eye Limiting Magnitude (NELM) in an area with a single observation. The higher NELM is, the more stars you can see. Clicking on a point or circle will bring up more information. Credit: myskyatnight.com
As streetlights the world over change from sodium lamps to LED, scientists wonder what this will mean for the artificial skyglow over cities. Because not every city lights the same way, the best way to understand whether skies worldwide are getting brighter or darker is to study the observations of citizen scientists. The new project "Myskyatnight", led by the GFZ German Research Centre for Geosciences and the Leibniz-Institute of Freshwater Ecology and Inland Fisheries (IGB), invites interested people from all over the world to examine changes in their night sky. The goal is not only for the participants to collect data. Instead, the new web-based platform makes all data available to the public, and offers tools to visualize and analyze the measurements.
Christopher Kyba is a researcher at the GFZ and IGB in Germany. He studies light pollution – too much light at the wrong time and place. He initiated the "Loss of the Night" app project in 2013, where citizen scientists from around the world send in their observations of sky brightness by determining the number of visible stars in the night sky. "The data from these observations are crucial for our science. We urgently need them to evaluate how skyglow is changing worldwide", says Kyba. This research cannot be done with satellites, because they measure the light emitted upward, not the light experienced on the ground by humans and other living creatures. A further complication is that the current satellites are not sensitive to the blue part of the visible spectrum. So far, only professional scientists have analyzed the skyglow data taken by citizen scientists. Kyba wanted to change that, and put the data and tools to analyze it back into the hands of the public.
Citizen science on a new level
Together with the company Interactive Scape GmbH in Berlin (www.interactive-scape.com), Kyba developed the web-based application "myskyatnight.com". The data from the "Loss of the Night" app and two other citizen science projects on light pollution are freely available there. Citizen scientists can easily navigate, view, and download the data, and perform their own analyses directly on the site. Users of the "Loss of the Night" app can also create a profile to easily view their own data.
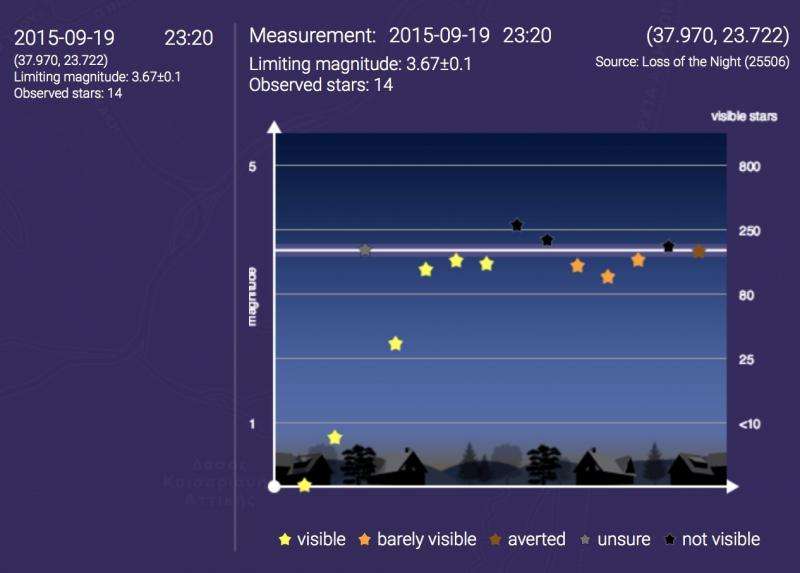
On this screenshot the data of a user’s entire “Loss of the Night” app observation is displayed. You can see which stars the participant was able to see (yellow for bright stars, orange for faint stars, dark orange for averted vision stars), as well as the stars that they couldn’t see (gray for unsure, black for not visible). The horizontal line shows the estimated naked eye limiting magnitude. Credit: myskyatnight.com
Kyba hopes that giving citizen scientists access to the data will increase their motivation to participate in taking data: "With the new web application, it's easy to see that the best results come when citizen scientists make multiple observations from the same location each year". The scientists also hope that the data will eventually feed back into local decisions about outdoor lighting. "In the ideal case, we will find examples of success stories: cities that invest in environmentally friendly lighting and end up seeing more stars above well-lit sidewalks".
The project was funded by the European Commission within the MYGEOSS program, which aims to develop smart Internet applications informing European citizens on the changes affecting their local environment. The new website became available on 3 December 2015.
Provided by Forschungsverbund Berlin e.V. (FVB)


