
Comprehensively mapped for the first time, Great Lakes wetlands, like this one in Cheboygan, Mich., provide important habitat and resources.
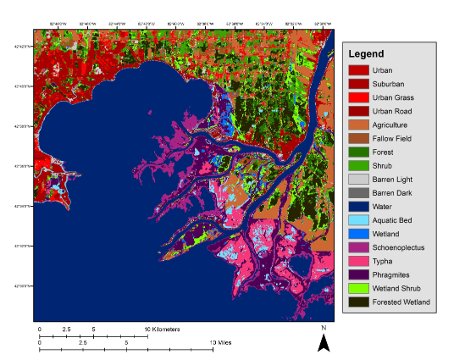
Fluorescent bands of color outline the Great Lakes on a new, comprehensive map of the region's coastal wetlands. This publicly available map is the first of its kind on such a broad scale—and the only one to trump political boundaries. Both Canadian and US wetlands are shown along more than 10,000 miles of shoreline.
The Great Lakes is an important focus of Michigan Technological University research. The coastal wetlands map is an extension of that focus, expanding on previous maps created through the Michigan Tech Research Institute (MTRI).
Laura Bourgeau-Chavez, MTRI research scientist and the project leader for the wetlands map, says establishing standard methods was crucial. "This is the first map to span the entire basin, and it's important to have a consistent map over the entire area," she says, explaining that inconsistencies impact data analysis and implementation of management strategies "if you don't know the accuracy of the map or how it's changing from one place to another."
Wetlands Changing
And wetlands are dynamic systems—there is a lot of change naturally happening, although most comes from humans. "We've lost more than 50 percent of coastal wetlands in the Great Lakes over the past century," Bourgeau-Chavez says. "The wetlands are very important because they serve as filtration as well as habitat—and a lot of them are being degraded."
Managing the remaining wetlands requires a 30,000-foot view.
Although it's more like a million-foot view, since the satellites used to map the wetlands orbit at about 200 miles above the earth's surface. Satellite imagery and measurements are techniques collectively called remote sensing.
"It's studying something from a distance," Bourgeau-Chavez says, adding that a lot of ground can be covered. "An example people are familiar with is using Google Earth, that's remote sensing."
Bourgeau-Chavez and her team specifically used three-season PALSAR remote sensing data, which is a 23 cm wavelength Synthetic Aperture Radar (SAR). SAR satellites are useful for measuring wetlands because the technique can distinguish flooded ground, vegetation's vertical structure, soil moisture and the total mass of vegetation. All these wetland features can vary greatly between seasons, so the satellite data was collected in spring, summer and fall.
Remote sensing can't replace field reports, however. Mixed readings—overlapping pixels in the data—blurred some of the map's boundaries, making vegetation type difficult to distinguish. With such an extensive map, field checking every point was impossible, but "we tried to get as many as possible within each mapped area," Bourgeau-Chavez says. To do so, her team visited more than 1,400 separate field sites.
Invasive Species
Visiting the sites allowed the researchers to double check the predominant vegetation, which is important for tracking invasive species like Phragmites (common reed) and cattails. Following Phragmites monocultures in the Great Lakes initiated the wetlands mapping.
In addition to keeping tabs on invasives, classifying different kinds of wetlands is a crucial map feature. For example, peatlands are an important wetland to separate out. The bogs are sometimes mined for peat, and they store large amounts of carbon.
"An emergent wetland that doesn't have any, or very little, peat at the surface is very different from a peatland with peat that is meters deep," Bourgeau-Chavez says.
Peatlands and other wetlands can be connected to water bodies even if they're not directly on one of the lakeshores. To account for this water connectivity, the researchers mapped 6.2 miles inland, creating the map's brightly colored band following the coast. Mapping inland also allowed the mapping team to see "the adjacent land that affects the quality of the water going into those wetlands," Bourgeau-Chavez explains.
There are a lot of other factors considered in land use management in addition to monitoring urban and agriculture proximity, invasive species and different wetland types. A variety of uses were built into the mapping interface, and viewers can also request data by clicking a button below the map legend.
So far, Bourgeau-Chavez says people have downloaded the data for everything from road building in Michigan to Lake Erie coastal restoration to research on grass carp.
"We have a whole list of people, both from Canada and the US, downloading the data," Bourgeau-Chavez says, adding that as the first comprehensive wetlands map of the Great Lakes, it has many applications.
She also notes the map is part of a greater initiative to develop better science resources for the Great Lakes. While large, the map is only part of the picture—a picture that will keep expanding with more detailed satellite imagery and updates as the region's wetlands change.
Provided by Michigan Technological University


