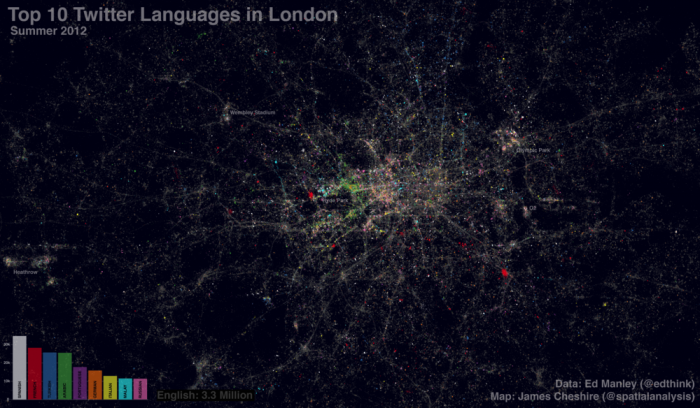
(Phys.org)—A doctoral student and a lecturer in spatial analysis have collaborated to deliver a London diversity map via Twitter based on 3.3 million tweets in the city over the course of this year's summer months.
Ed Manley, the PhD student, University College London, and James Cheshire, a lecturer at UCL's Centre of Advanced Spatial Analysis, were able to detect no less than 66 languages in use although unsurprisingly English dominated. Manley, whose work looks at movement around the city, especially how and why it forms and changes, said the data generation method was "quite simple," using Google's Chromium Compact Language Detector. The latter is an open-source Python library adapted from the Google Chrome algorithm.
Basque, Haitian Creole and Swahili were among the languages detected. Tagalog, spoken in the Philippines, was the seventh most tweeted language. The study revealed concentrations of tweets as well. Turkish appeared to be concentrated in the north; pockets of Russian tweets in central London; and Arabic, in the west.
The map is interesting but there are numerous limitations to prevent one's coming away with a true understanding of language used daily in London. Many tweets, from people who had a good GPS location and who were connected to the Internet, were along train commuter lines and from people at events.
The fact can't be lost that the examination included the summer period; many languages detected could have come from the Olympic event. Manley fully recognizes the limitations. "I won't dwell too much on discussing the results, only that Twitter appears to reveal itself here to be the severely skewed dataset we all always really knew it was," he said. "In total, 92.5% of tweets are detected as English, far above existing estimations (60%) of English speakers in London…languages you'd expect to score highly such as Bengali and Somali barely feature at all. Either people only tweet in English, or usage of Twitter varies significantly among language groups in London."
He realizes that "there is a great deal you can say about bias within the Twitter dataset, but I think I'll save that for another day."
Nonetheless, one can enjoy the fact that Twitter offers scientists opportunities to identify patterns, trends and social networking insights. In this instance, the Twitter exercise confirmed the global nature of London's population. This would not be the first time Twitter has been used for information mapping.
Earlier this year, the New England Complex Systems Institute (NECSI) set out to map the social, political, and geographical properties of news-sharing communities on Twitter. They tracked user-generated messages that had links to The New York Times online articles. They labeled users according to link topics they shared, their geographic location, and their self-descriptive keywords. With users clustered based on who follows whom in Twitter, they found social groups separated by whether they were interested in local (New York), national (US) or global issues.
Interestingly, while Twitter is said to create communication across continents, Twitter may at the same time be strengthening walls that separate users into ideological camps. "A person who is cosmopolitan associates with others who are cosmopolitan, and a US liberal or conservative associates with others who are US liberal or conservative, creating separated social groups with those identities," said Yaneer Bar-Yam, NECSI president, commenting on the findings.
More information: urbanmovements.posterous.com/
© 2012 Phys.org


