Tracking animal epidemics through road network

Road transport is one of the main vectors of animal epidemics. It is vital to understand how potentially infected animals are transported and exchanged within a country. A French-Italian team, including researchers from the Centre de physique théorique and the Epidémiologie, systèmes d'information, modélization unit, has just presented large-scale numerical simulations to test potential scenarios of a cattle epidemic in Italy. The model is the first to take into account day-to-day variations in the Italian animal transportation network and could lead to new prevention and monitoring strategies. This work has been published on the website of the Journal of the Royal Society Interface.
Transportation of farm animals over long distances is vital for their rearing and for the agri-food industry. However, it also facilitates the spread of pathogens. This was illustrated by the Foot and Mouth Disease epidemic that hit the UK in 2001 and cost around 8 billion GBP, and the 2006 swine fever epidemic in Germany in 2006, whose indirect costs are estimated at 60 million euros. Furthermore, there is increasing concern that animal diseases could pose a threat to human health, as recently shown by bird flu and the H1N1 virus.

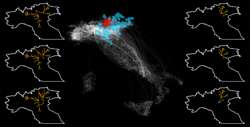
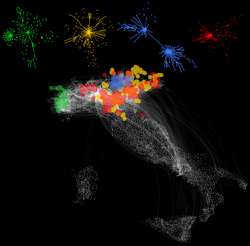
To study how potentially infected animals are exchanged and transported within a country, and how this can affect the spread of an epidemic, the researchers used data from the movement records of 5 million cattle throughout 2007 in Italy. They built a model using tools from the complex network analysis. In mathematics, a network is a series of points (“nodes”) interconnected by communication paths. In the present case, the nodes were farms and the paths represented animal transport routes between them.
This model is novel in that it takes into account changes occurring from one week to another and even from one day to the next in the Italian animal transport network. Traditional models, by comparison, are based on a fixed network, which can lead to inadequate prevention and health screening measures. The researchers built digital simulations to predict how a disease in any Italian farm would propagate by road throughout the country. More importantly, this work could help identify the farms that require priority surveillance once an epidemic breaks out or is suspected. Moreover, in the case of a crisis, the model could be used to trace the path of infection back to the farm of origin. Finally, the research shows that the most important farms to monitor are not only those where animal transport is the busiest, although simpler models that do not account for network dynamics would predict this. Because standard characteristics are insufficient to identify the farms at risk, the researchers are now developing mathematical models to achieve this.
Although this work takes a pure science approach in developing new mathematical models, it could easily serve as a basis for creating a powerful, user-friendly tool for animal health authorities. In addition, the researchers hope to extend their study to the rest of Europe.
More information: Optimizing surveillance for livestock disease spreading through animal movements, Paolo Bajardi, Alain Barrat, Lara Savini and Vittoria Colizza, Published the 22 June 2012 on the site: Journal of the Royal Society Interface.
Journal information: Journal of the Royal Society Interface
Provided by CNRS


