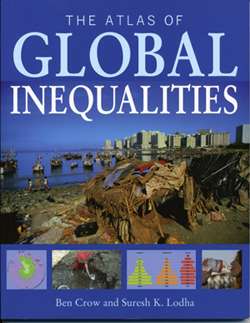
New atlas takes a graphic approach to global inequalities

In 2005, the UC Atlas of Global Inequality went online at UC Santa Cruz. The site uses downloadable maps and graphics allowing students to explore and research various inequalities around the world.
Now, millions of hits later, the interactive research project has been turned into a book, The Atlas of Global Inequalities, (University of California, Press, 2011) shepherded by the same two UC Santa Cruz professors who got the web site up and running six years ago.
In true UCSC fashion the Atlas is an interdisciplinary effort and one that involves undergraduates throughout. Authorship is credited to Associate Professor of Sociology Ben Crow and Professor of Computer Science Suresh K. Lodha, but they'll be the first to tell you the real research and work was performed by a distinguished crew of students from two of Crow's classes "World Society" and "Exploring Global Inequalities."
"The joy is working with the students," Lodha said.
Crow explained that despite the web site's popularity it was difficult to sustain. UC Press expressed interest in an electronic atlas. From those conversations emerged a plan with Myriad Editions, a book packager in the United Kingdom that publishes a line of atlases such as the Atlas of Migration, Atlas of Human Rights, and Atlas of Climate Change.
The Atlas of Global Inequalities looks at economic, gender, power, health, access, educational, and environmental inequalities. Most are presented in colorful two-page "spreads" that illustrate the material in easy-to-comprehend charts, graphics, and diagrams.
"It's difficult work," Crow said, "to try to translate academic research into popular accessible ideas."
Data must be "distilled into something understandable," said Lodha, describing the process as "information of visualization."
"There is a tendency for the hard sciences to take a common sense approach to social issues," Lodha said, but in this case he found a deeper engagement in the material through the process of putting together the book. "It is pretty powerful."
One of the dozen or so researchers who dug up the data and distilled it is Jasmine Lopez, a third-year biology major from San Diego. She said she took Crow's class as part of her GE requirements, got involved with the project, and now plans to minor in sociology.
"I'm surprised I would enjoy it as much," Lopez said. She contributed spreads on disease, such as HIV, malaria, and tuberculosis; also government action and distribution of wealth.
Taralyn Kawata, a third-year sociology major from Sacramento, researched sections on labor migration, particularly internal migration in China, also freedom and democracy, two concepts, as she points out, that can be measured in different ways.
The book is both a product and a process, Crow said, "a case study of project-based learning."
He also noted, "It showed me Santa Cruz has the best undergraduates, they are fabulous."
More information: ucatlas.ucsc.edu/
Provided by University of California - Santa Cruz


