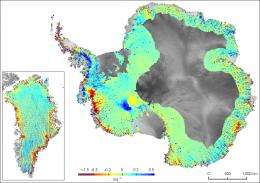
A web of satellite tracks, from NASA's Ice, Cloud, and land Elevation Satellite, reveal areas of dynamic thinning (red) in Antarctica and Greenland. Credit: British Antarctic Survey/NASA
(PhysOrg.com) -- Researchers have used NASA’s Ice, Cloud and Land Elevation Satellite (ICESat) to compose the most comprehensive picture of changing glaciers along the coast of the Greenland and Antarctic ice sheets.
The new elevation maps show that all latitudes of the Greenland ice sheet are affected by dynamic thinning -- the loss of ice due to accelerated ice flow to the ocean. The maps also show surprising, extensive thinning in Antarctica, affecting the ice sheet far inland. The study, led by Hamish Pritchard of the British Antarctic Survey in Cambridge, England, was published September 24 in Nature.
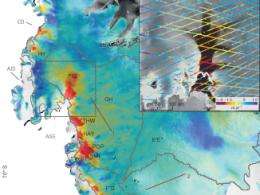
Satellite data shows fast ice thinning (red) along the coast of West Antarctica. The inset shows satellite tracks over Pine Island Glacier, from NASA's Ice, Cloud, and land Elevation Satellite, which reveal dynamic thinning concentrated on the fast-flowing areas. Credit: British Antarctic Survey/NASA
ICESat’s precise laser altimetry instrument, launched in 2003, has provided a high-density web of elevation measurements repeated year after year across the Greenland and Antarctic ice sheets. With the dense coverage, the research team could distinguish which changes were caused by fast-flowing ice and which had other causes, such as melt.
The maps confirm that the profound ice sheet thinning of recent years stems from fast-flowing glaciers that empty into the sea. This was particularly the case in West Antarctica, where the Pine Island Glacier was found to be thinning between 2003 and 2007 by as much as 6 meters per year. In Greenland, fast-flowing glaciers were shown to thin by an average of nearly 0.9 meters per year.
More information: www.nature.com/nature/journal/ … ull/nature08471.html
Provided by JPL/NASA (news : web)


