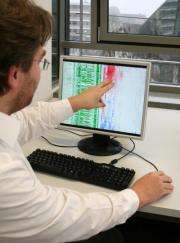
Analytical eye: Viewing through the data jungle

Unmanageable volumes of data accumulate in our digitized working world. Scientists are developing analytical techniques that make use of our ability to identify complex data relationships by means of pictorial images.
Every day vast amounts of information flood into business databases. To achieve their corporate objectives, companies try to evaluate information relevant to their activities as effectively as possible. In the day-to-day working environment they use business intelligence programs to collect, evaluate and present data. But many of the current analytical methods can only display information statically, as lists or reports. Visualization techniques help to present the information in a form that can be more easily understood.
Dr. Jörn Kohlhammer, head of the department responsible for this project at the Fraunhofer Institute for Computer Graphics Research (IGD) in Darmstadt, explains: "With Visual Analytics we combine analytical methods and visualization techniques. The user and the computer interact closely, but the user is always in the forefront. He or she makes the decisions, not the system."
Instead of tables of figures, the system can for example display a mosaic of colored surfaces. If columns of figures differ from the customary data, they are shown in a different color or with a different structure, so that they catch the eye immediately. By concentrating on these patterns, users can evaluate the data more accurately. Connections or relationships that could easily be overlooked also become more noticeable. This makes it easier to reach reliable decisions. Kohlhammer: "Visual Analytics has a lot to offer the financial market in particular. Trends and risks in global finance could be identified more quickly."
The EU is aware of the importance of Visual Analytics for the European economy and has initiated the »VisMaster CA« project. Supervised by the Fraunhofer IGD, 26 European industrial companies and research institutes - including IBM and SAP - are cooperating on new approaches to master the flood of information. The Fraunhofer IGD will be presenting current developments in Visual Analytics in Hall 9, Stand B36 at this year's CeBIT trade fair, to be held from March 2 to 6 in Hanover, Germany.
Provided by Fraunhofer-Gesellschaft


