Video: Napoleon Bonaparte and the insulin revolution
A team of Sydney researchers has drawn inspiration from a 19th century map, commissioned by Napoleon to chart his defeat in Russia, to show how insulin works in the human body.
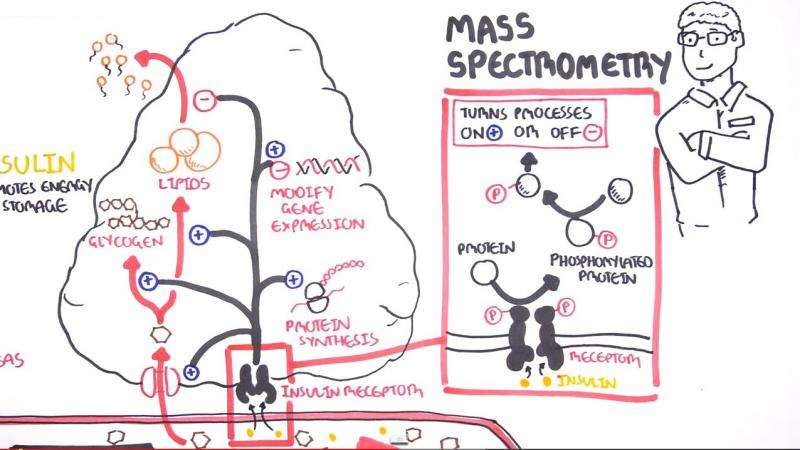
Published in Cell, the simple yet sophisticated diagram charts in unprecedented detail the insulin/IGF1 signalling pathway (ISP), a complex network of molecular interactions triggered by insulin which plays an essential role in long-term health, obesity and diseases such as diabetes.
"The science is about how insulin works. When we eat glucose it comes into the bloodstream and triggers insulin secretion. Insulin then travels via the blood and binds to receptor molecules, principally on muscle, fat or liver tissue," said Professor David James, Leonard P Ullmann Chair of Metabolic Systems Biology at the University of Sydney's Charles Perkins Centre.
"The great complexity begins when the insulin binds to that tissue, which initiates a very convoluted series of many thousands of molecular events.
"These events don't just happen all at once - they can come on very quickly or very slowly, some go up and some go down, some happen in the nucleus, some happen in other parts of the cell.
"For the first time, our team has been able to display all of the main events in a simple image, making it easier for researchers to understand it.
"It's really a visual gateway to a whole spectrum of biology. It's a work of art," Professor James said.
The map draws on landmark research by Professor James and was created by data visualisation specialist Dr Séan O'Donoghue, Office of the Chief Executive Science Leader at CSIRO and Senior Faculty Member at the Garvan Institute of Medical Research. The interdisciplinary team also included molecular biologists, bioinformaticians, data visualisation experts and a graphic designer.
Dubbed 'Minardo', the diagram was inspired by a map designed by French civil engineer Charles Minard and commissioned by Napoleon Bonaparte to chart his disastrous Russian campaign of 1812.
It is hoped Minardo will help explain ISP to students and scientists in other areas, improving understanding of the vitally important but poorly understood process.
"We also think Minardo will be very useful for other scientists working in other areas such as cancer, who may be able to use the same concept for their branch of science," Professor James said.
Minard's map is famous for charting six types of data in one image - the number of Napoleon's troops, distance, temperature, latitude and longitude, direction of travel, and location relative to specific dates.
Dr O'Donoghue's design condenses multiple dimensions of information, including time, cellular topology, and a range of specific biochemical processes such as fatty acid secretion, inhibition of lipolysis and the initiation of glycolysis and protein synthesis. An interactive online version allows users to see moving parts and find additional information by hovering over the displayed events.
According to Professor James, the project is exemplary of the Charles Perkins Centre's mission to bring researchers together from disparate disciplines to solve complex problems.
"As a result of this simplification, we may be able to shed new light on a complex network that's incredibly significant to our physiology.
"It's within these complex systems that we find some of the most important remaining challenges for human health," Professor James said.
Journal information: Cell
Provided by University of Sydney


