Geography Department launches websites providing data on Hawai'i's climate

The Geography Department in the College of Social Sciences at the University of Hawai'i at Mānoa (UH Mānoa) has launched a new, interactive water resource management website on evapotranspiration that, when added to the existing Rainfall Atlas of Hawai'i website, will form a family of products providing critical information on the state's average climate and water processes.
Evapotranspiration, the process by which water is returned to the atmosphere through evaporation of moisture from leaves and soil and through transpiration from plants during photosynthesis, is a critical component of the hydrologic cycle as it provides approximately 14 percent of the water vapor in the Earth's atmosphere.
"Understanding and quantifying this movement of moisture within the atmosphere is critical to the management of Hawai'i's water resources and the protection of its natural environment. It is a key component in the analysis of how climate change, land development and species invasion will affect the islands' natural ecosystems, agriculture and domestic water availability," said Dr. Thomas Giambelluca, a climatologist and hydrologist in the UH Mānoa Geography Department.
"The research conducted by Dr. Giambelluca and his students will prove invaluable as we work to address the growing challenges Hawai'i faces due to climate change. The practical applications of this data, beyond climate modeling and resource management, are far reaching. For example, evapotranspiration rate predictions may help the agriculture sector estimate potential water demands for crops and determine the optimum time for irrigation. Similarly, the solar industry may find the solar radiation data useful in developing projections for photo voltaic needs," said Hong Jiang, chair of the Geography Department.
Giambelluca and his students collected, analyzed and mapped a range of data variables including evapotranspiration, wet canopy evaporation, transpiration, soil evaporation, potential evapotranspiration, solar radiation, clear sky solar radiation, cloud frequency, albedo, net radiation, air temperature, relative humidity, vapor pressure deficit, wind speed and soil moisture. More than 12,000 data maps were created, covering each hour of the average 24-hour cycle for each month and each hour of the average 24-hour cycle for the year. Average values for each month and the annual average were also mapped.
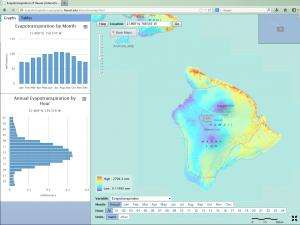
The websites include interactive maps that allow users to see the spatial patterns for each variable. Individuals may also zoom in on areas of particular interest, navigate to specific locations using different base maps, and click on a location to obtain the mean value of the selected variable, graphs of the mean monthly and hourly values, and obtain tables with mean hourly, monthly and annual values of all variables for a selected location.
More information: The evapotranspiration websites may be found at evapotranspiration.geography.hawaii.edu/.
Provided by University of Hawaii at Manoa


