Maths tells when to be more alert on the roads

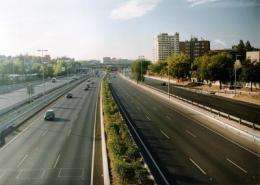
Technicians from Madrid City Council and a team of Pole and Spanish researchers have analysed the density and intensity of traffic on Madrid's M30 motorway (Spain) throughout the day. By applying mathematical algorithms, they have verified that drivers should pay more attention to the road between 6pm and 8pm to avoid accidents.
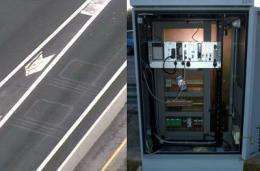
Detection devices installed by the Department of Traffic Technologies of Madrid City Council on the M30 motorway and its access roads were used to conduct a scientific study. Researchers from SICE, the traffic management company in charge of this thoroughfare, used past records to develop a new device that determines the time during which more attention should be paid to the road.
This period is the same as the shortest lifetime of spatio-temporal correlations of traffic intensity. In the case of the M30, it has proven to be between 6pm and 8pm, according to the study published in the Central European Journal of Physics.
"Between 6pm and 8pm, the most 'stop and go' phenomena occur. In other words, some vehicles break and others set off or accelerate at different speeds," as explained to SINC by Cristina Beltrán, SICE engineer, who goes on to say that "vehicle speeds at consecutive stretches of the motorway are less correlated during these periods."

The researcher clarifies that traffic conditions that vary quickly in space and time means that "drivers should always pay more attention on the roads as to whether they should reduce or increase their speed or be aware of road sign recommendations."
Reference data were taken during a 'typical week' on the 13 kilometre stretch of the M30 using detectors at intervals of approximately 500 metres. These devices record the passing speed of vehicles and also how busy the road is (the time that vehicles remain stationary in a given place). Then, using algorithms and models developed by AGH University of Science and Technology (Poland), correlations were analysed.
Free flow, Passing and Congested Traffic
The team focused mainly on the intensity of traffic (vehicles/hour) and density (vehicle/km) during the three phases of traffic: free flow, congested and an intermission named 'passing' or synchronised. The easiest to categorise is the first, where intensity and density grow exponentially with hardly any variation, but the other two also show correlations.
This information helps us to take traffic control measures during rush hours, provide speed recommendations that can alter traffic characteristics and offer alternative routes via less congested areas," outlines Beltrán. "This is all part of Madrid City Council's objective to actively research new systems for improving traffic flow on the M30."
The study enjoyed the support of the European Union's 7th Framework Programme through the SOCIONICAL Project (www.socionical.eu) and the results were cross-referenced with data from the USA's Insurance Institute for Highway Safety. The work of this scientific and educational organisation is geared towards reducing human and material loss as a result of road accidents.
More information: Małgorzata J. Krawczyk, Cristina Beltran Ruiz, Krzysztof Kułakowski. "Situations in traffic - how quickly they change". Central European Journal of Physics 9 (6): 1452-1457, December 2011. arXiv:1012.3907v1. Available on arxiv.org/pdf/1012.3907.pdf


