Joining the dots to put pollution on the map
(PhysOrg.com) -- Air pollution monitors tell us a great deal about their immediate locations -- and not much about the wider area. To fill the gaps on the map, European researchers have developed new statistical tools for a web-enabled world.
Imagine another nuclear accident like Chernobyl. Across Europe, measurements show increased radioactivity, but it’s not yet clear how much has been released or where it is coming from. One measuring station reports high radiation levels, yet 30km away, on the other side of a city, the readings are much lower. Should the authorities evacuate the city, and if so, where to?
European research in statistics has made it easier to answer questions like this, and many others relating to less dramatic forms of air and water pollution. By providing new ways to turn a set of point measurements into a contour map that can be published on the web in real time, scientists hope to make existing environmental data more useful, reliable and democratic.
Interpolating from points to areas
All sorts of environmental issues, from nuclear and chemical spills to groundwater pollution and traffic fumes, involve decisions based on measurements taken at a relatively small number of points, notes Edzer Pebesma of the University of Münster, Germany. Air quality monitoring stations, for instance, have become a common sight in Europe, but the high cost of setting them up and running them will always limit their numbers.
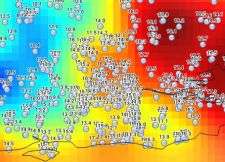
So how do you find the value of an environmental variable at a point on the map where there is no monitoring instrument? Statisticians call this process interpolation. Starting with a fixed number of measurements taken in defined places, the challenge is to create a contour map that shows what is happening between the measurement points, and to say how accurate we can expect these contours to be.
Pebesma heads the EU-funded INTAMAP project, which spent three years developing new statistical methods and software for interpolating environmental data. Though the mathematics involved are complex, the researchers took care to address real-world issues, Pebesma says. For instance, depending on how much time is available, the software decides whether it can use the most accurate interpolation techniques or must settle for less sophisticated models that are quicker to calculate.
Making the technology open and easy to use was reckoned so important that it took up a considerable part of the project’s resources, Pebesma says. The open-source interpolation software at the core of the project links to the outside world through web services. For instance, the system accepts raw data published on the web using open standards developed by the Open Geospatial Consortium (OGC). Once the numbers have been crunched, web services that also conform to OGC standards can create maps automatically, display them on the web and update them as needed.
Rating the accuracy of the maps was another big issue. Though statisticians are used to assessing the reliability of their predictions, the researchers found no existing way to convey this information in the context of web services. They therefore created UncertML, a new dialect of the XML document markup language, which looks set to become a standard for exchanging information about uncertainty.
Getting users on side
The researchers put a lot of effort into convincing potential users that the project was worthwhile. Scientists responsible for radiation monitoring, for instance, are traditionally suspicious of interpolation, says Pebesma - “yet they still have to make difficult recommendations about whether and where to evacuate the city”. A measure of the project’s success is that the German radiation protection authority (the Bundesamt für Strahlenschutz, or BfS), is now using the INTAMAP system to visualise hourly readings of gamma radiation provided by the European Radiological Data Exchange Platform (EURDEP).
Researchers whose job is to map urban and industrial air pollution - particulates and nitrogen oxides, for instance - have also seen the value of INTAMAP’s automated approach. Pebesma says the INTAMAP tools could also help the study of weather, groundwater pollution, agriculture, medical imaging and many other areas where a two-dimensional picture needs to be built up from a series of point readings.
The ability to create high-quality maps without needing to employ a statistician will help to make environmental data more useful and accessible, Pebesma suggests. Levels of particulates, for instance, can vary a great deal between locations only a short distance apart, so someone who cycles to work could benefit from INTAMAP’s ability to calculate their average exposure to pollutants and compare different routes. One of the project partners, Aston University, has already produced a mobile phone application which maps temperature from data provided by home weather stations.
INTAMAP has been highly rated by its reviewers. The project has built agreement among geostatisticians on which methods to use for interpolating different kinds of data and how to choose between them automatically, and enthused potential users about the value of interpolation. It has implemented complex statistical methods in a transparent way that allows their use by non-specialists, and given rise to several new research projects.
More information: INTAMAP project - www.intamap.org/
Provided by ICT Results


