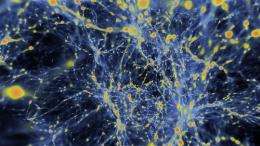
Argonne streaming visualization sends images across the world (w/ Video)

(PhysOrg.com) -- Modeling the evolution of the universe is no mean feat, not only because of the complex mathematics involved, but also because of the sheer amount of data that is generated from a working model of -- well, the universe.
Dealing with data, however, is the specialty of a group of scientists at the U.S. Department of Energy's (DOE) Argonne National Laboratory. To more easily share and analyze the mountains of data from today's scientific challenges, they are developing software that enables researchers to interact with their results in real-time from across the country.
The rise of supercomputers has given a powerful tool to scientists, who use these machines to model complex questions. As the compute power of such resources increases, so does the complexity of the questions that can be asked—and the size of the data sets that are generated.
“Finding the resources and software capable of rendering volumes of data at such large scales can be a challenge,” said Mark Hereld, visualization and analysis lead for Argonne’s Leadership Computing Facility (ALCF). Fortunately, the ALCF is home to Eureka, one of the world’s largest graphics supercomputers, which features 200 high-end graphics processing units. Eureka enables software such as vl3, a volume rendering toolkit developed at Argonne and the University of Chicago, that leverages graphics hardware to visualize such data sets in real time.
Networking advances make it feasible to move large amounts of data from the location where it was computed to specialized visualization resources where it can be rendered into images. However, the scientists who need to analyze this data often live and work far from both supercomputing and rendering clusters. It is vital that the renderings be brought to the scientist.
To see the subtle details in the data and make full use of the visualizations, high-quality images are also required. New vl3 enhancements allow researchers to stream hi-res images created on graphics clusters to a remote cluster driving a high-resolution tiled display.
To illustrate the importance—and feasibility—of visualization at a distance, scientists from several organizations, including institutions from both the National Science Foundation’s TeraGrid project and from DOE, teamed up to create a live demonstration using vl3. Images were streamed live at 10 gigabits per second from Eureka in ALCF over DOE's ESnet, a high-speed network with dedicated bandwidth for moving large datasets worldwide, to an OptiPortal tiled display in the San Diego Supercomputer Center's booth at this year’s annual Supercomputing Conference (SC09).
"As a team, we were able to link institutions across the country and leverage high performance computing, visualization resources, high speed networks and advanced displays in real-time,” said Joe Insley, principal software developer at Argonne. “But what was really wonderful was seeing the scientists get excited about the possibilities that this will enable.”
The next step will be to add controls already present in the local version of the software to the wide-area version, giving the scientist even more power to investigate his or her data.
The simulation was done as part of a 2009 TeraGrid resource allocation entitled “Projects in Astrophysical and Cosmological Structure Formation”, designed to simulate the cosmic structures of the early universe by calculating the gravitational clumping of intergalactic gas and dark matter. The model uses a computational grid made up of 40003 cells, contained 64 billion dark matter particles and took over four million CPU hours to complete.
The project used resources from the National Institute for Computational Sciences, a joint project of the University of Tennessee and Oak Ridge National Laboratory. The visualization of the results was also enabled in part by the TeraGrid visualization team at the University of Chicago.
More information: More information about the project, including links to the animation, is available at press.mcs.anl.gov/futureslab/2 … oject-stargate-sc09/
Provided by Argonne National Laboratory


